Note
The satellite data in this post (Sentinel-1, NISAR and the optical scenes) was retrieved, processed and composited by the author. Claude compiled the text from those processed results and from public news reporting. Processing parameters and acquisition times are taken from the data itself; the event description and casualty figures come from the public sources linked in the text.
At 02:52:10 UTC on 2026-08-26 (08:37 Nepal time, 10:52 China time), an ice and rock cliff on the north side of Langtang Lirung collapsed inside Langtang National Park. USGS located the source from seismic waves, on the north face of a peak roughly 7,200 m high; the main event released energy equivalent to M5.2, followed about 3 hours later by a secondary collapse equivalent to M4.2. AntarcticGlaciers gives the detachment coordinates as 28.2853°N, 85.5252°E and states that the present evidence does not support a glacial lake outburst flood (GLOF); the proposed mechanism is a multi-hazard cascade of ice and bedrock failure, rock/ice avalanche and debris flow, temporary river blockage, then outburst flooding. The author describes all of these as preliminary.
The debris flow travelled about 100 km down the Bhote Koshi and Trishuli rivers and destroyed the customs facilities at the Rasuwagadhi border crossing along with the China–Nepal highway. The Wikipedia article records, as of 28 August, 547 dead and 977 missing on the Nepali side and 5 dead and 558 missing on the Chinese side; the search is ongoing, sources differ in what they count and when they were updated, and the figures are still changing. The same area saw a large ice and rock avalanche during the 2015 Gorkha earthquake that buried villages in the Langtang valley and killed more than 350 people.
This post records the data work done in the two weeks after the event: building the Sentinel-1 pre-event baseline, processing the first obtainable post-event SAR data (NISAR, L-band) and the first post-event Sentinel-1 scene, and then the four viewing geometries that followed.
Cloud cover in the post-event optical imagery
August is monsoon season in Nepal. NESRA FloodWatch records the post-event optical cloud cover as 62–93% across the 9 PlanetScope scenes in the Planet Crisis Response release, and around 50% for the SkySat scene of 27 August.
The images below cover the Timure reach: pre-event 2026-05-27 PlanetScope (3.7 m), post-event 2026-08-27 Pelican (0.55 m). Drag the axis to switch between them.
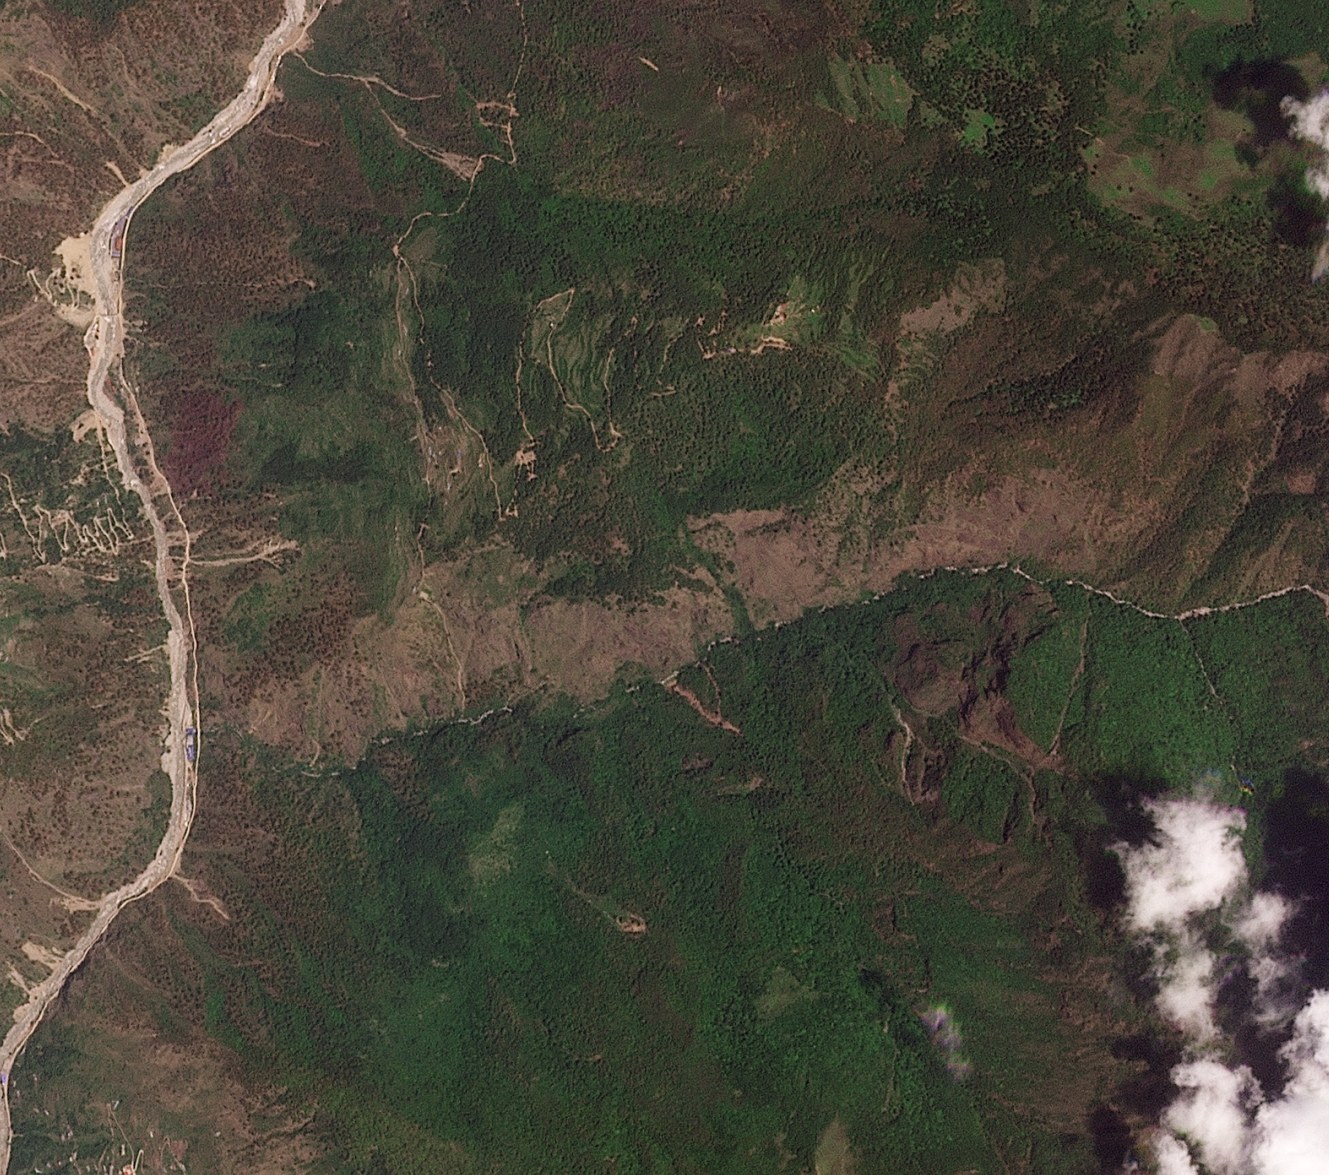 Pre-event 05-27 PlanetScope
Post-event 08-27 Pelican
Pre-event 05-27 PlanetScope
Post-event 08-27 Pelican
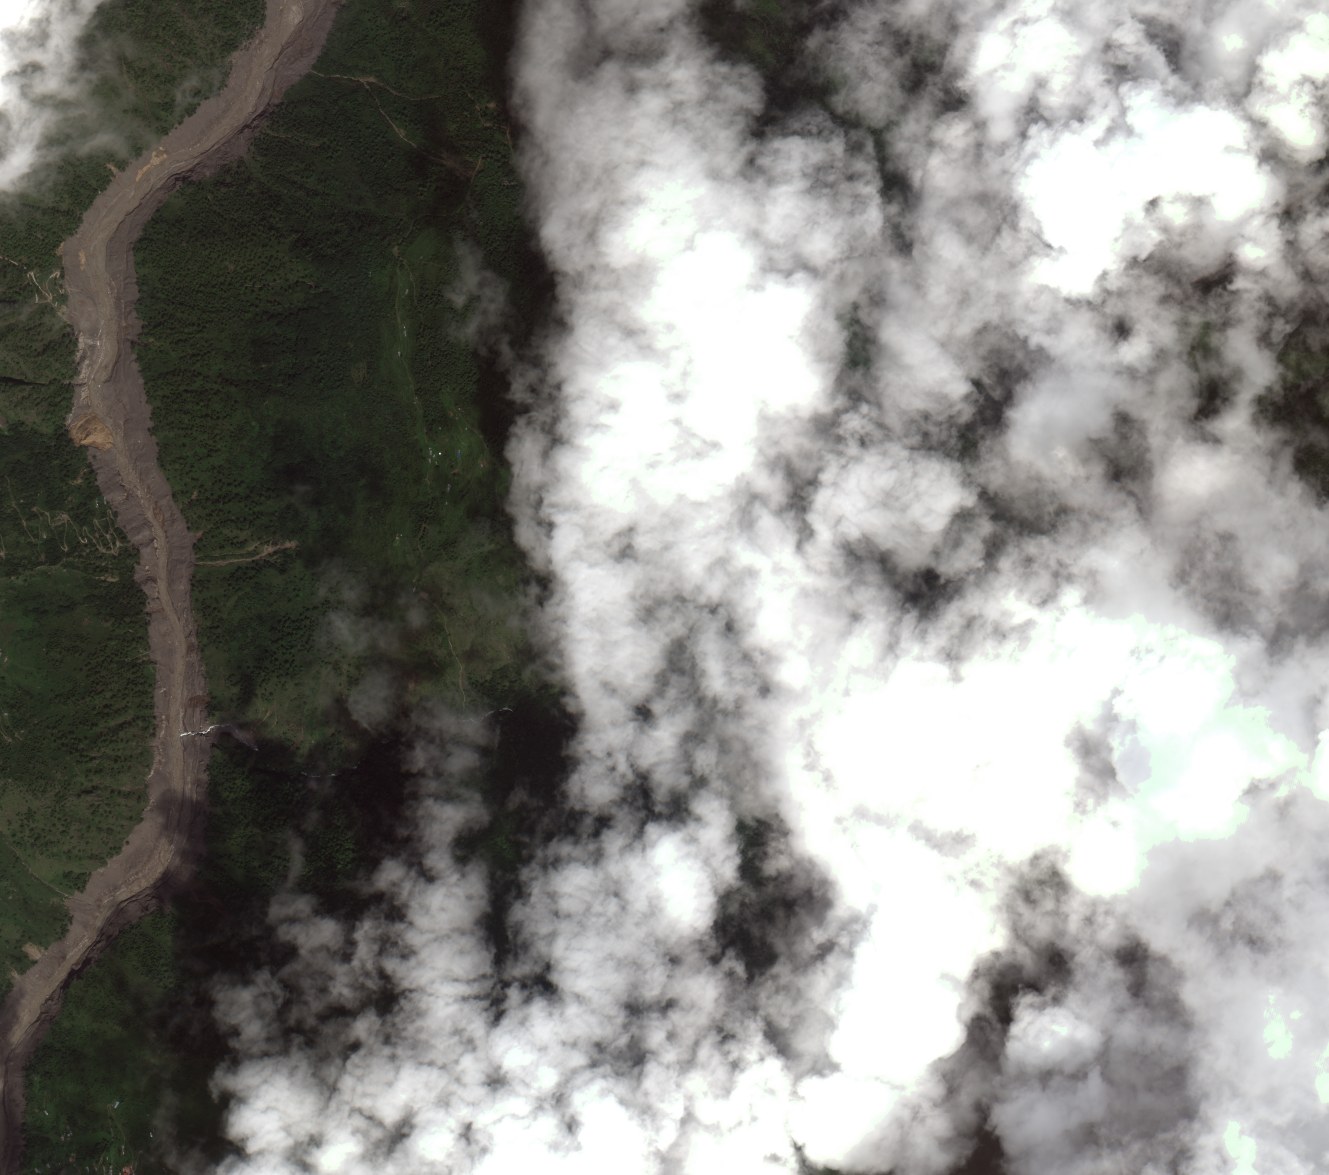
The Planet Crisis Response programme acquired a further PlanetScope batch on 28 August (04:57–05:01 UTC, 5 scenes, nominal cloud cover 64–90%). The comparison below mosaics several scenes per date over the corridor extent (85.15–85.60°E, 28.10–28.40°N): pre-event is the pre-monsoon 05-27 acquisition, post-event is 08-28. Coverage is incomplete on both dates (valid data covers 64% of the window pre-event and 78% post-event, with missing wedges left as dark background). In the post-event cloud gaps, a widened grey channel runs continuously from the top right (the Rasuwagadhi–Timure reach and the Langtang Khola junction) through the full frame; in the pre-event mosaic the same drainage is a thin line:
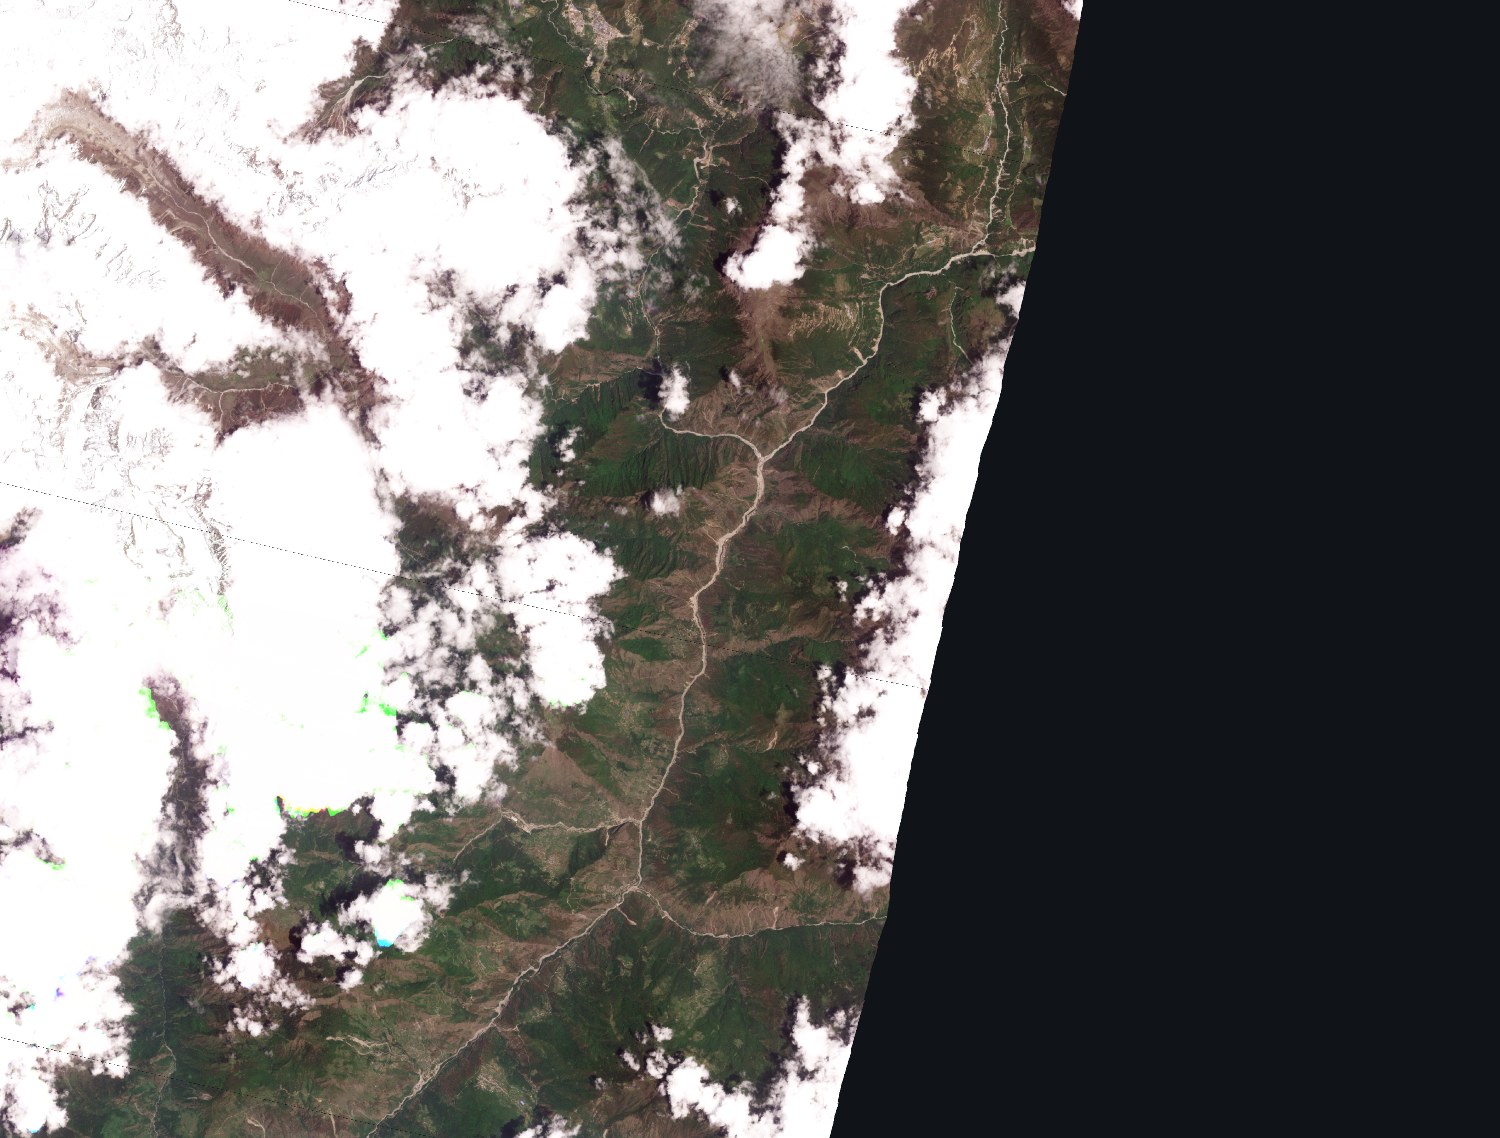 Pre-event 05-27 PlanetScope
Post-event 08-28 PlanetScope
Pre-event 05-27 PlanetScope
Post-event 08-28 PlanetScope
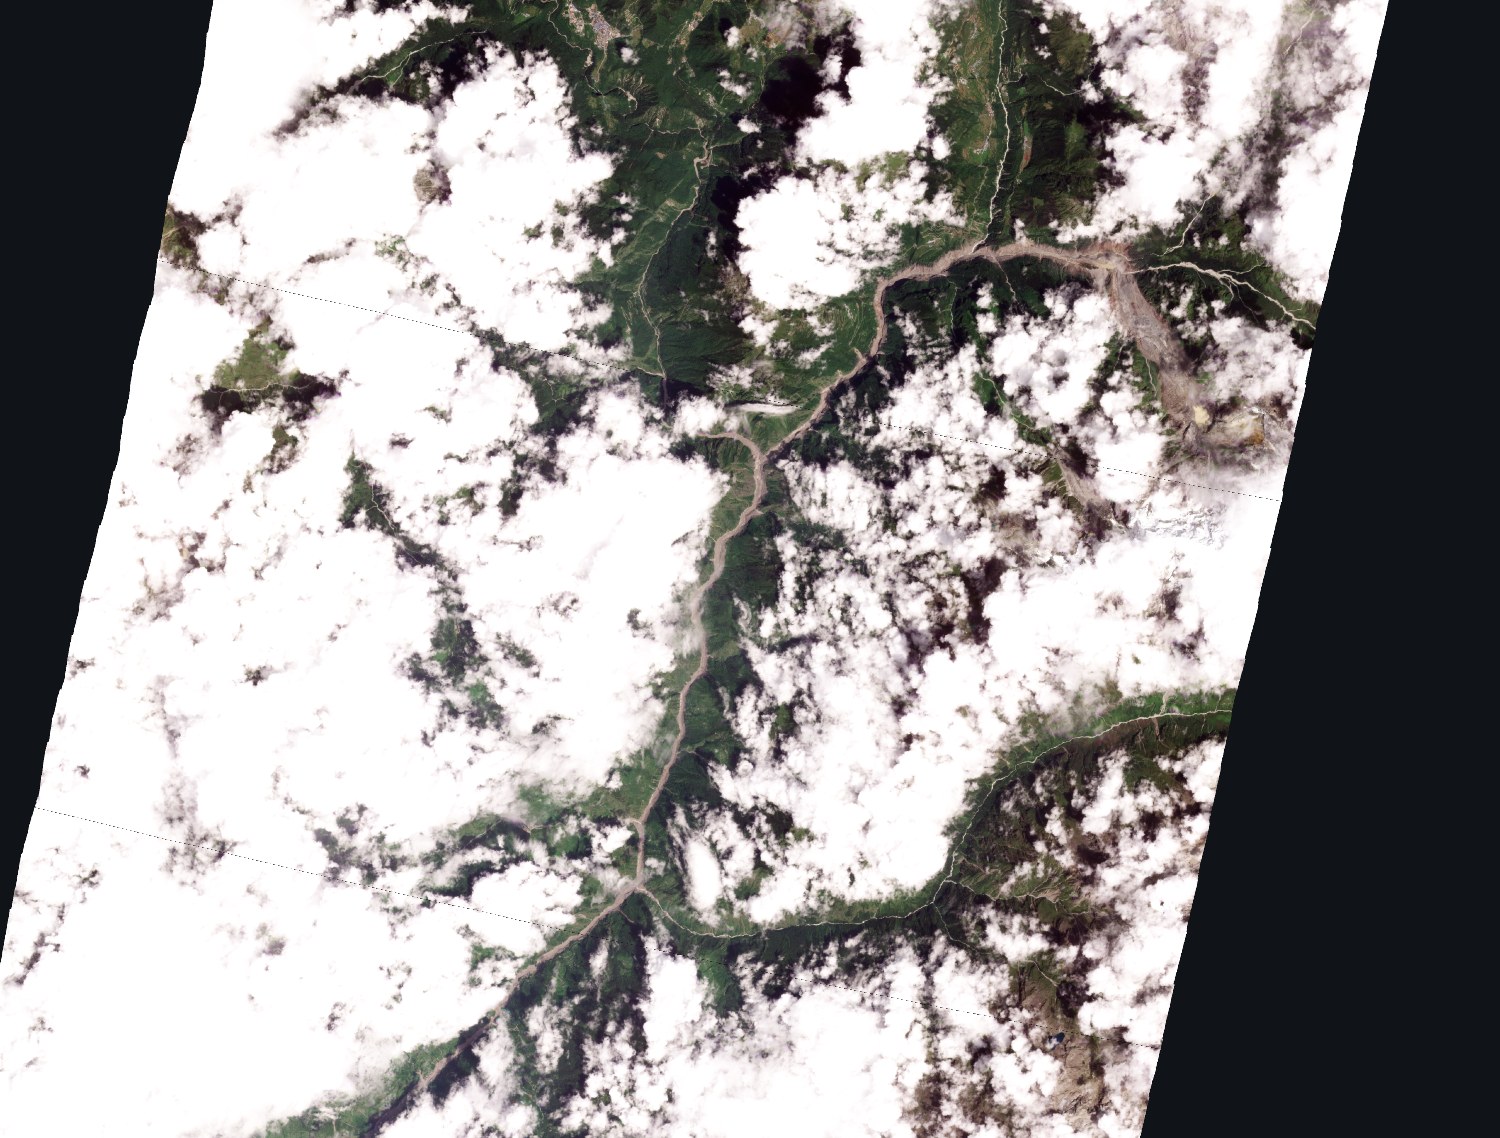
Synthetic aperture radar (SAR) actively transmits microwaves and receives the echo, so imaging does not depend on illumination and the microwaves pass through cloud. SAR imaging geometry is at the same time governed by terrain: relief in the deeply incised Himalayan valleys is extreme, and radar images of it contain layover and shadow.
SAR sources
Sentinel-1 (C-band)
The AOI (85.1–85.7°E, 27.8–28.5°N) archive was searched on ASF Search. Every scene over this area within the window comes from Sentinel-1D, with a 12-day revisit on each of three tracks:
| Time (UTC) | Track | Look direction | Status |
|---|---|---|---|
| 08-16 12:21 | path 85 ascending | east | Pre-event baseline (ascending) |
| 08-19 00:10 | path 121 descending | west | Pre-event baseline (descending 1) |
| 08-24 00:18 | path 19 descending | west | Pre-event baseline (descending 2) |
| 08-26 02:52 | — | — | Ice collapse and debris flow |
| 08-28 12:21 | path 85 ascending | east | First post-event scene, ingested |
| 08-31 00:10 | path 121 descending | west | Post-event scene, ingested |
| 09-05 00:18 | path 19 descending | west | Post-event scene, ingested |
| 09-09 12:21 | path 85 ascending | east | Second post-event scene, ingested |
The 08-24 scene precedes the event by 2.1 days and is the closest pre-event acquisition; 08-28 follows it by 2.4 days and is the closest post-event acquisition. Each track’s pre/post pair spans 12 days.
The primary source is the Sentinel-1 RTC (radiometric terrain corrected) γ⁰ product hosted on Microsoft Planetary Computer, readable anonymously. The same platform also hosts the raw GRD, without that correction applied. Clips cover the affected corridor, 85.15–85.60°E, 28.10–28.40°N, at 20 m.
NISAR (L-band)
NISAR has pre-event products covering the AOI on 11, 16, 19 and 23 August, distributed through the ASF DAAC; extrapolating the 12-day revisit puts the first post-event pass on 28 August. NISAR is L-band, at a wavelength of about 24 cm; Sentinel-1 is C-band, at about 5.6 cm.
NISAR products are distributed through two parallel processing streams. The routine stream carries _PR_ in the product name and its interferometric endpoint is NISAR_L2_GUNW_PROVISIONAL_V1, the Provisional in that endpoint meaning the products are provisional; the post-disaster stream carries _UR_ (Urgent Response), with the endpoint NISAR-UR/UR_L2_L_GUNW, built for rapid delivery after an event, and its endpoint name carries no equivalent term. Both streams process the same downlinked data, and one acquisition can exist in both: the path 98 scene of 08-31 has a GCOV in each stream, with acquisition start and stop times identical to the second. For the path 98 event pair used here, the urgent-response product appeared first and the routine product afterwards. This post does not judge whether one stream supersedes the other.
The NISAR products used in this post fall into three families. Every interferometric product (GUNW) comes from the routine stream. Among the amplitude products (GCOV), the path 48 post-event scene of 08-28 is from the urgent-response stream and every other scene is from the routine stream. The offset products (GOFF) are used only in the path 48 section and come from the routine stream.
Commercial SAR
No commercial SAR had been released publicly as of the evening of 28 August: Capella Open Data holds only two unrelated August 2026 tasks, from the 18th and 19th; the Umbra Open Data STAC catalogue has no 2026 entries; ICEYE and iQPS have published nothing. The satellites operated by these companies are X-band; the only public L-band data found for this event is NISAR. The International Charter has been activated for this event; charter products go to response agencies and the source data is not public.
Sentinel-1 pre-event same-orbit pairs (C-band)
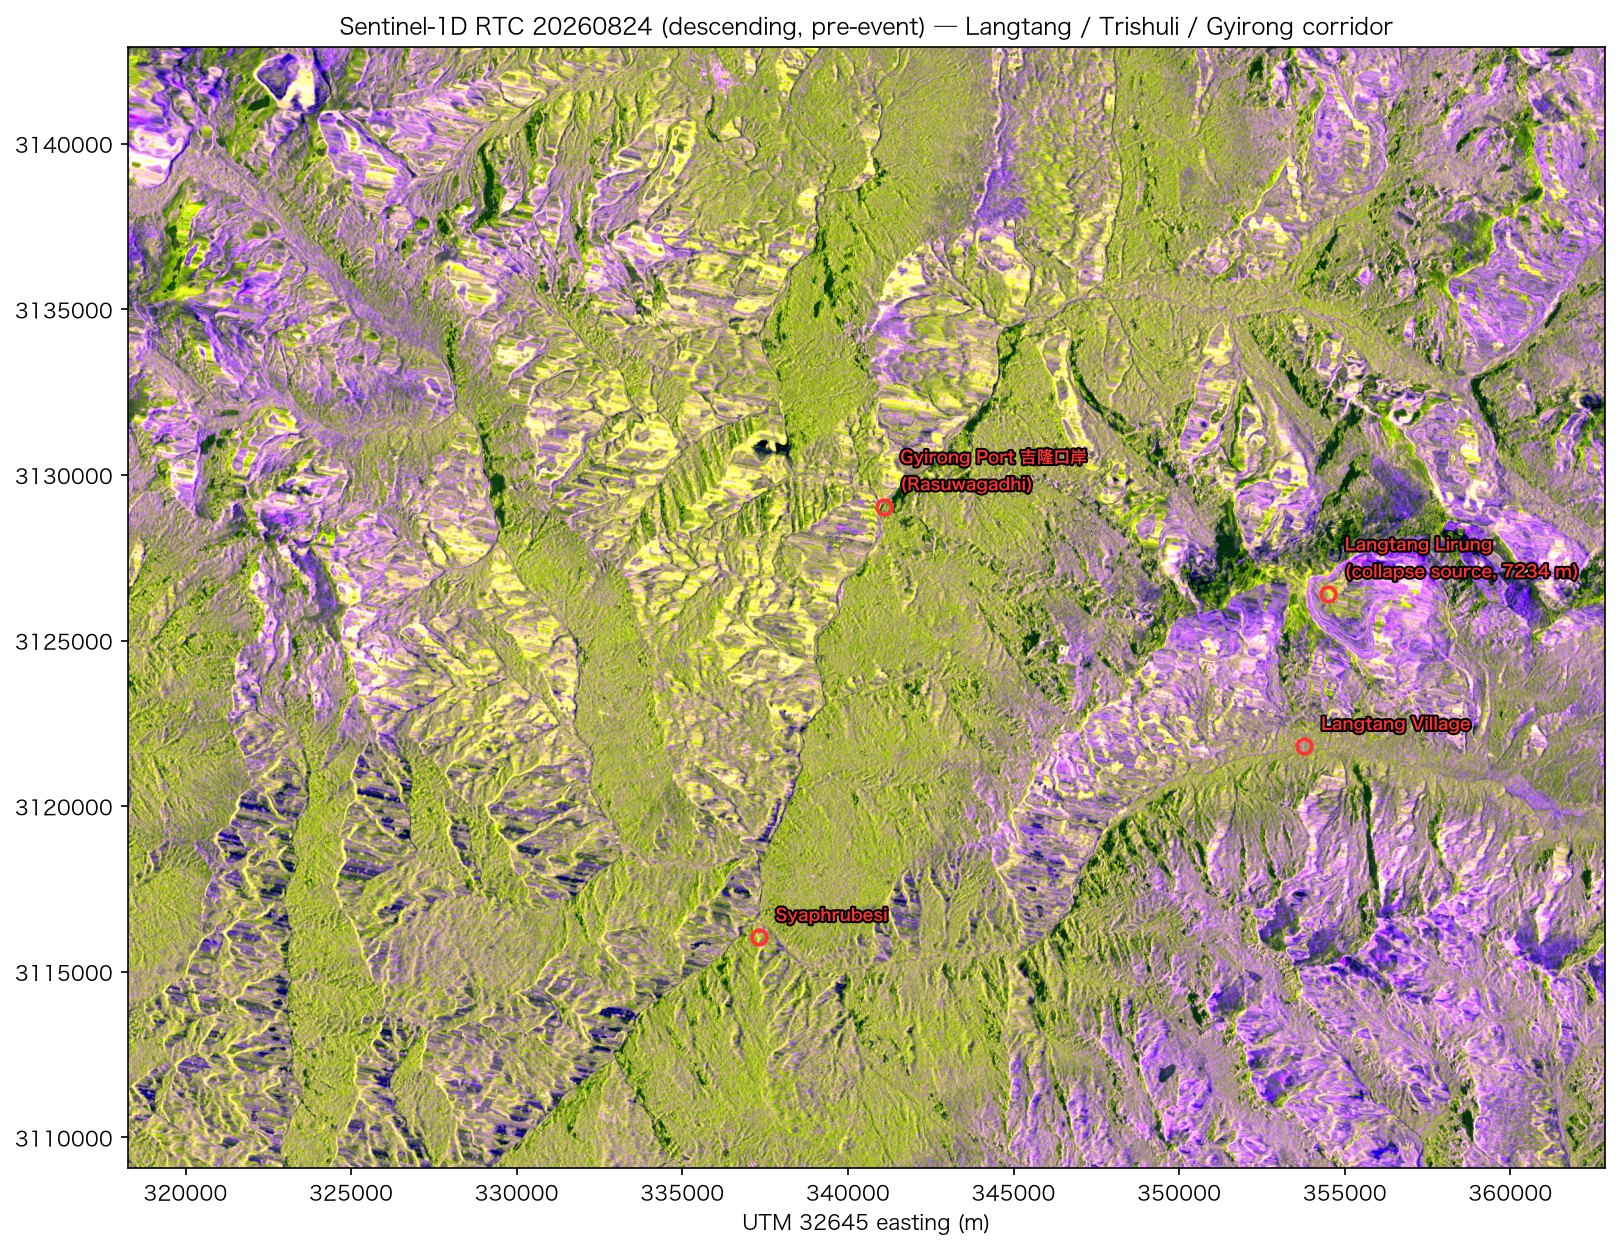
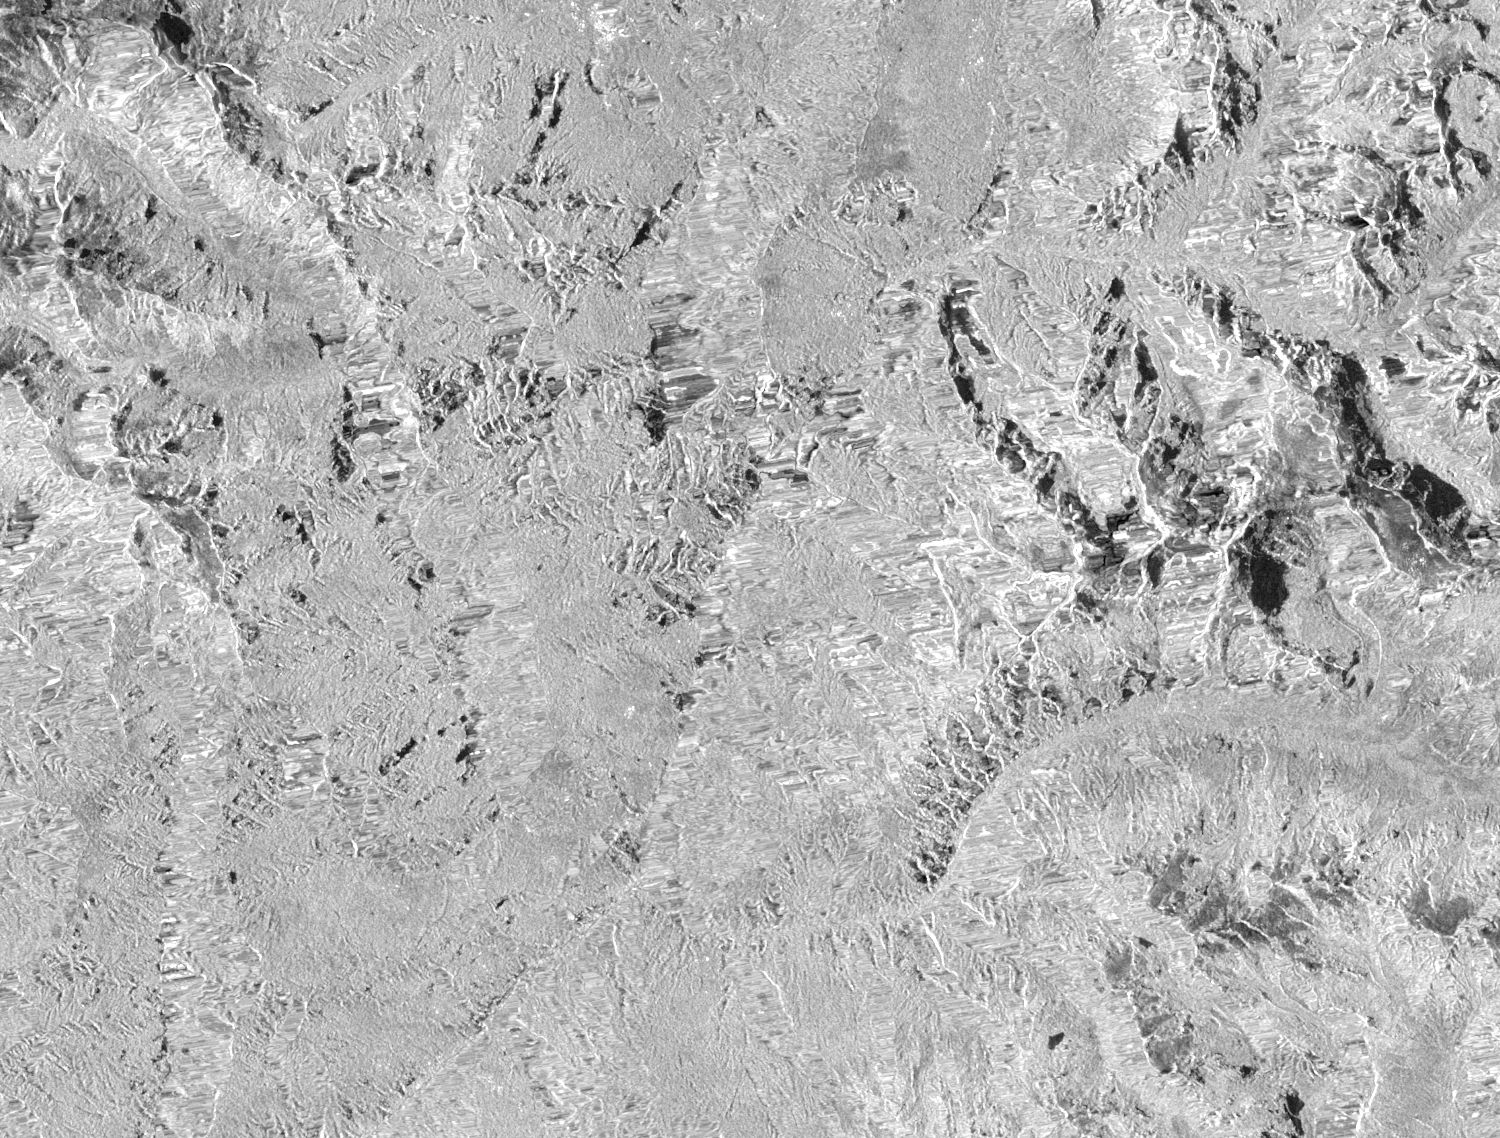
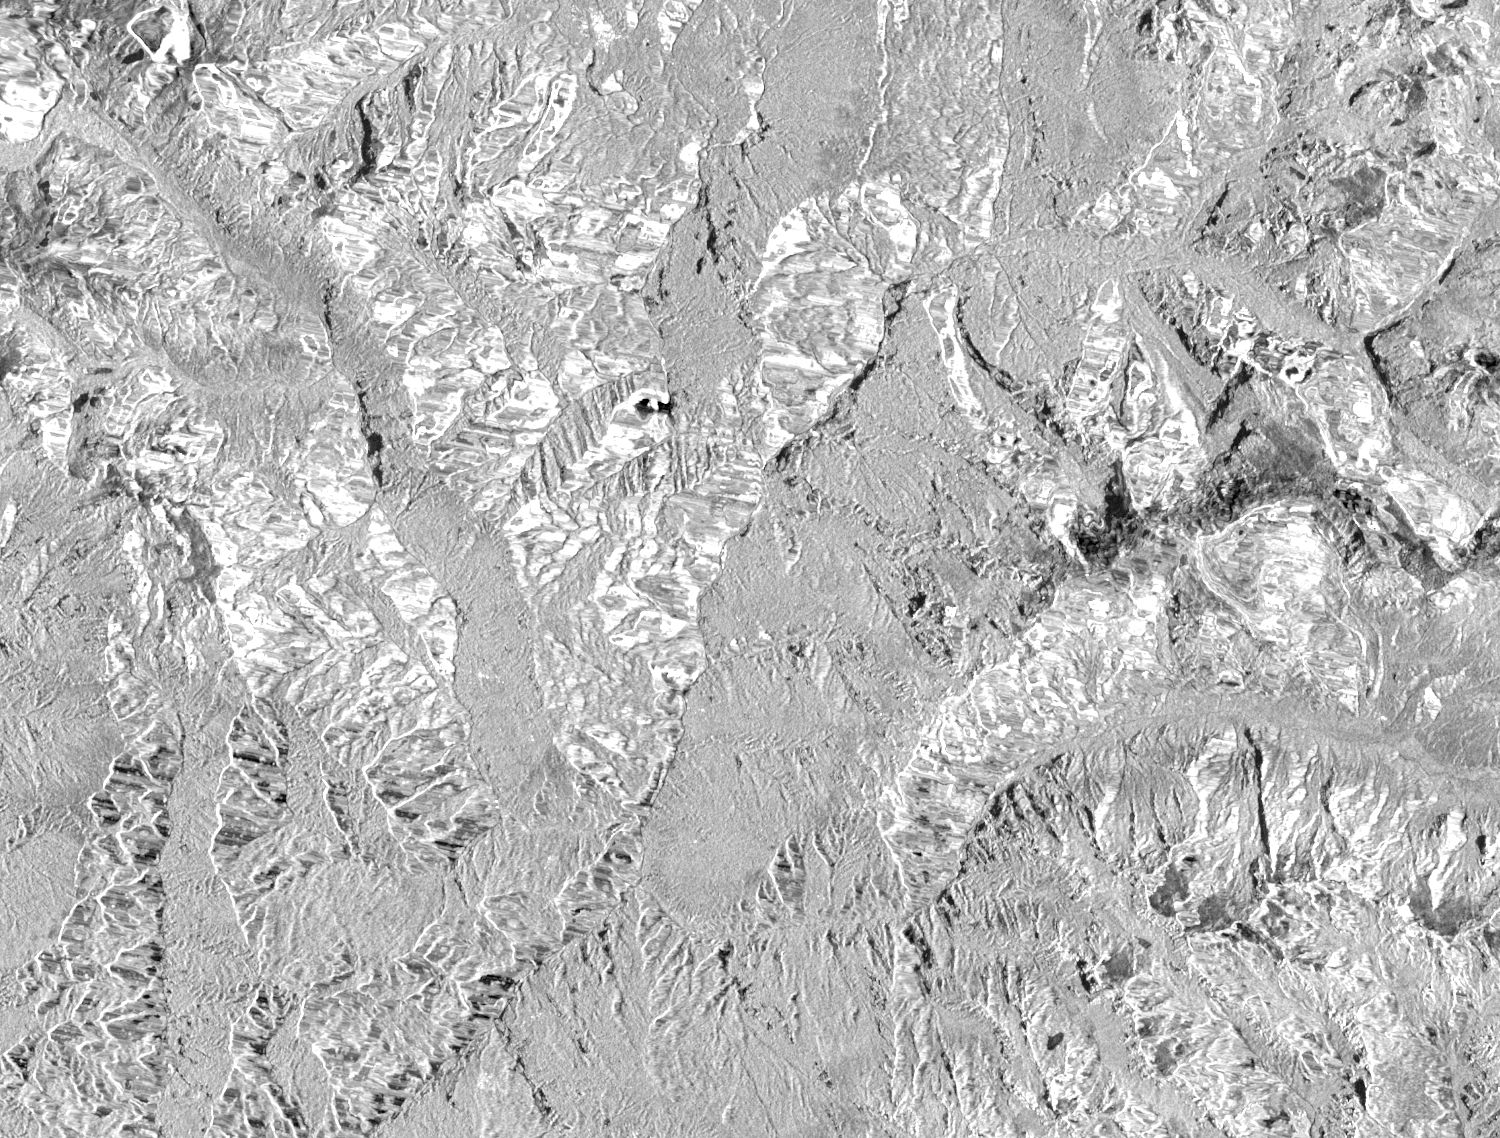
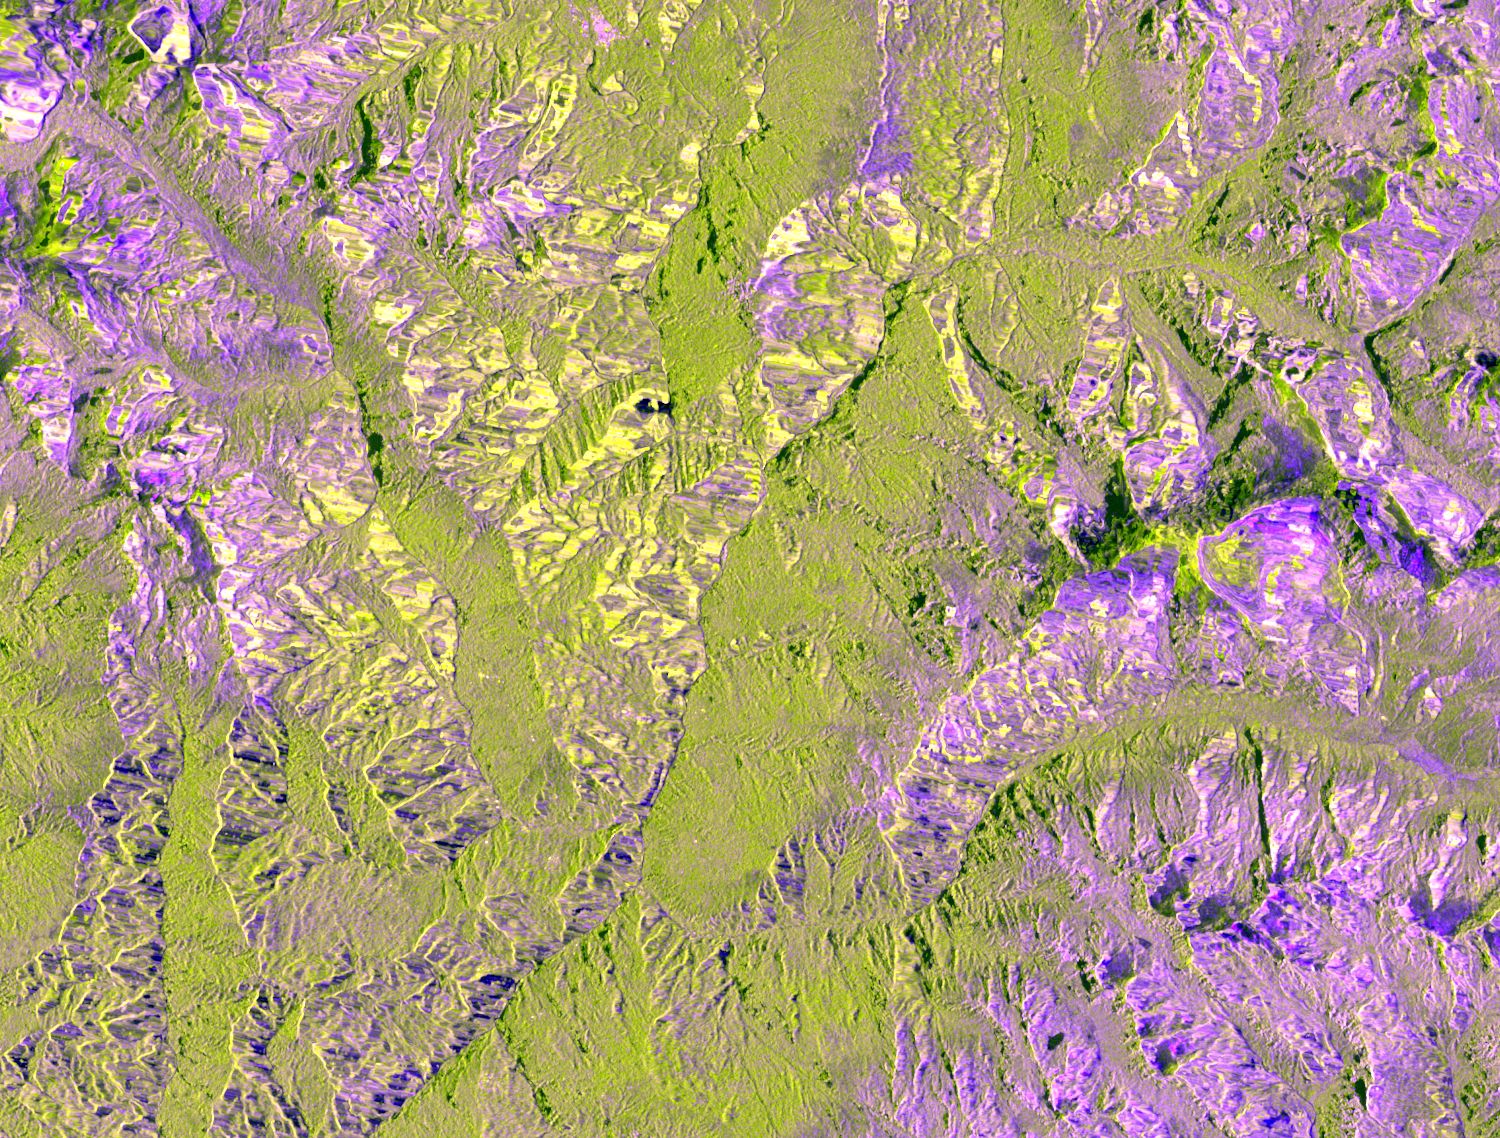
The two pairs below are pre-event acquisitions from the same track, 12 days apart, with no event within either interval. Each pair is shown under both renderings: VV backscatter, with the greyscale spanning −25 to 0 dB, where bright areas are rough rock and slopes facing the radar and dark areas are smooth surfaces; and the dual-polarisation composite (R=VV, G=VH, B=VV−VH), where green is vegetated slope and purple and blue are glacier, bare rock and layover.
The first pair is path 85 ascending, 08-04 and 08-16:
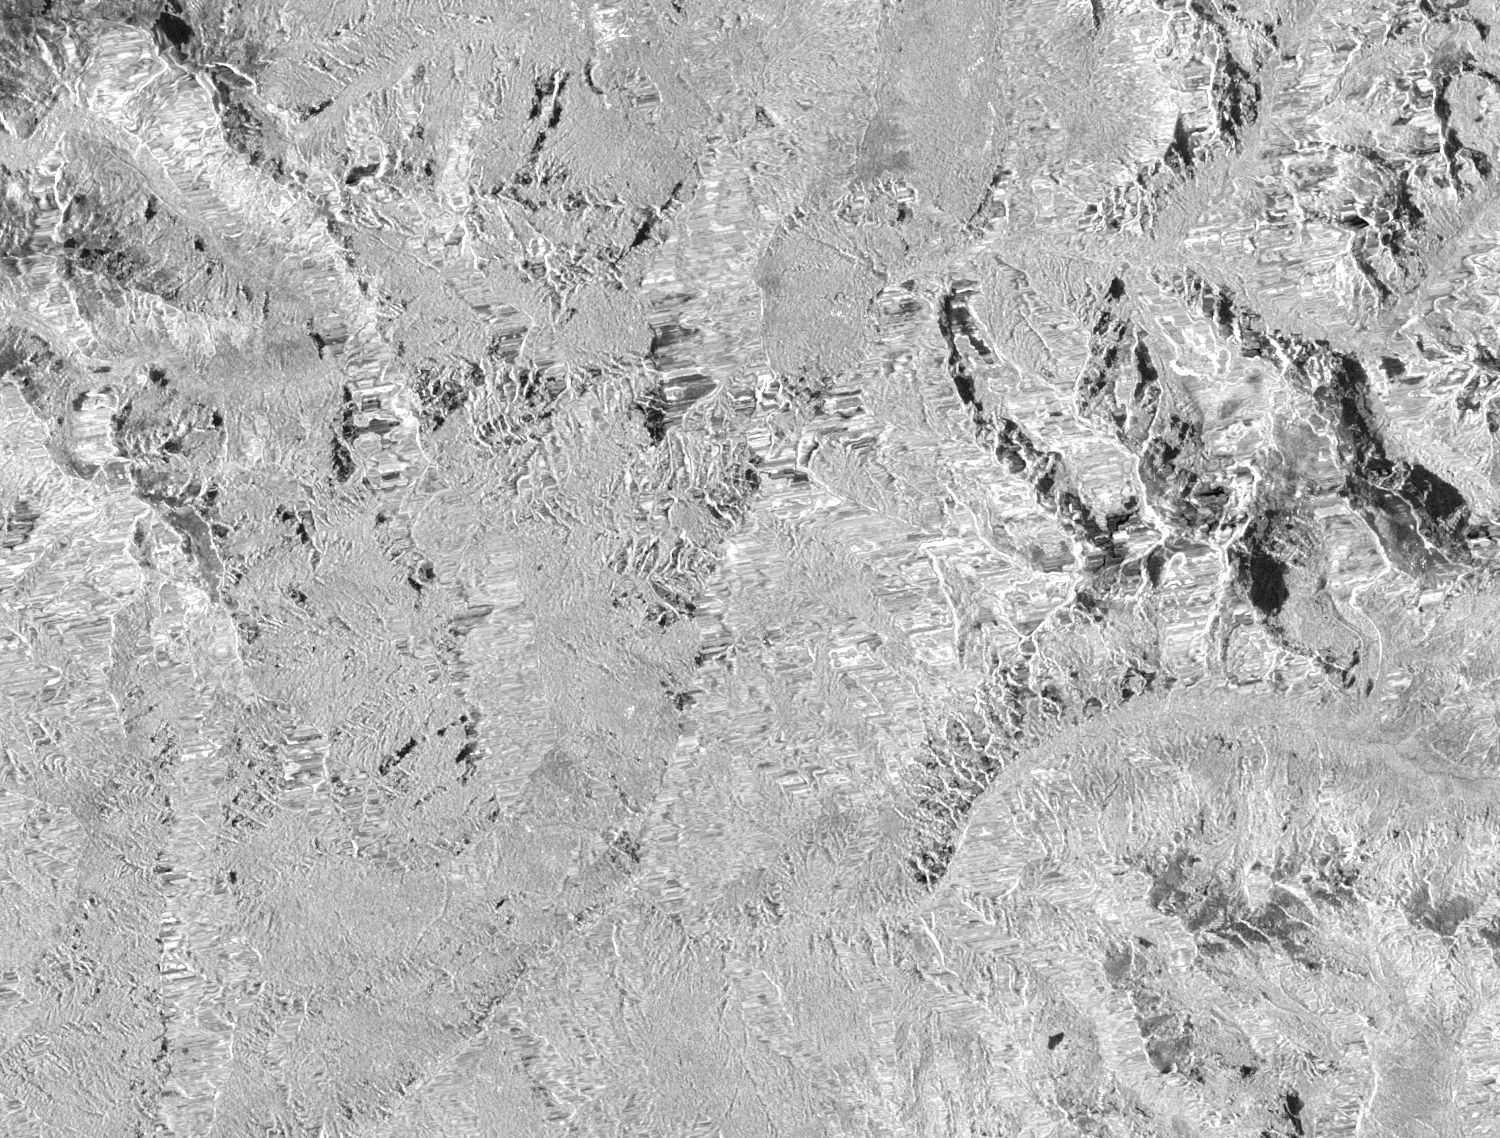 08-04 ascending VV
08-16 ascending VV
08-04 ascending VV
08-16 ascending VV
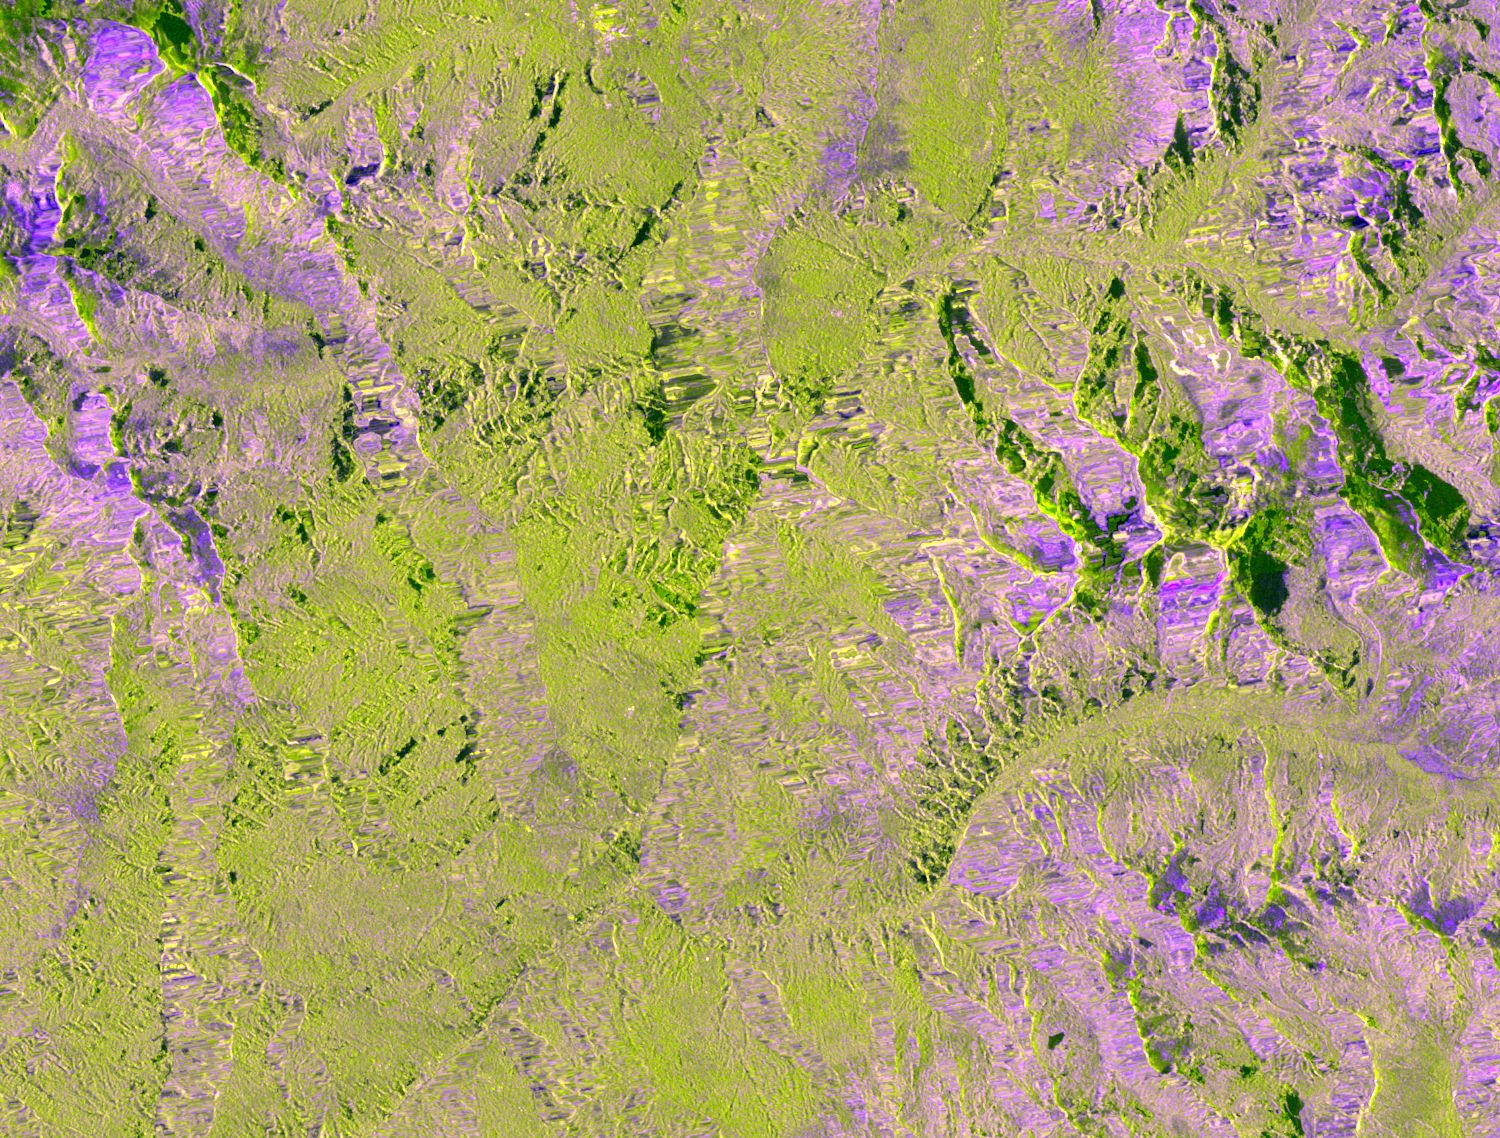 08-04 ascending composite
08-16 ascending composite
08-04 ascending composite
08-16 ascending composite
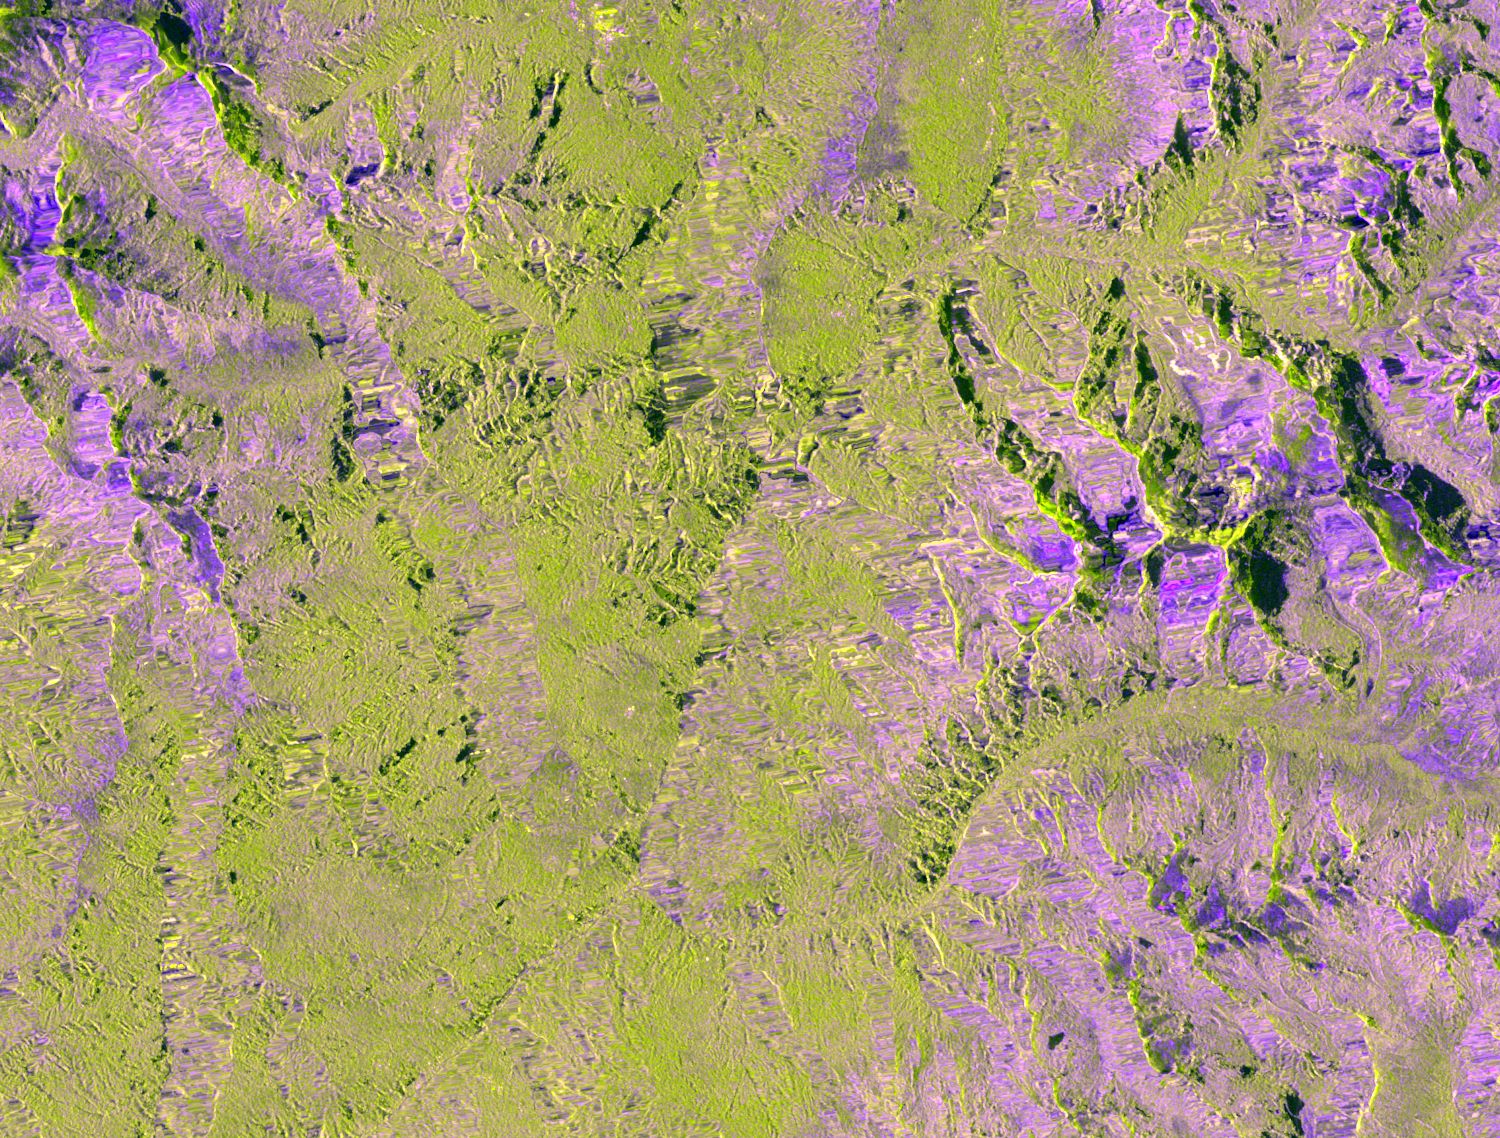
The second pair is path 19 descending, 08-12 and 08-24, the latter being the scene acquired 2 days before the event:
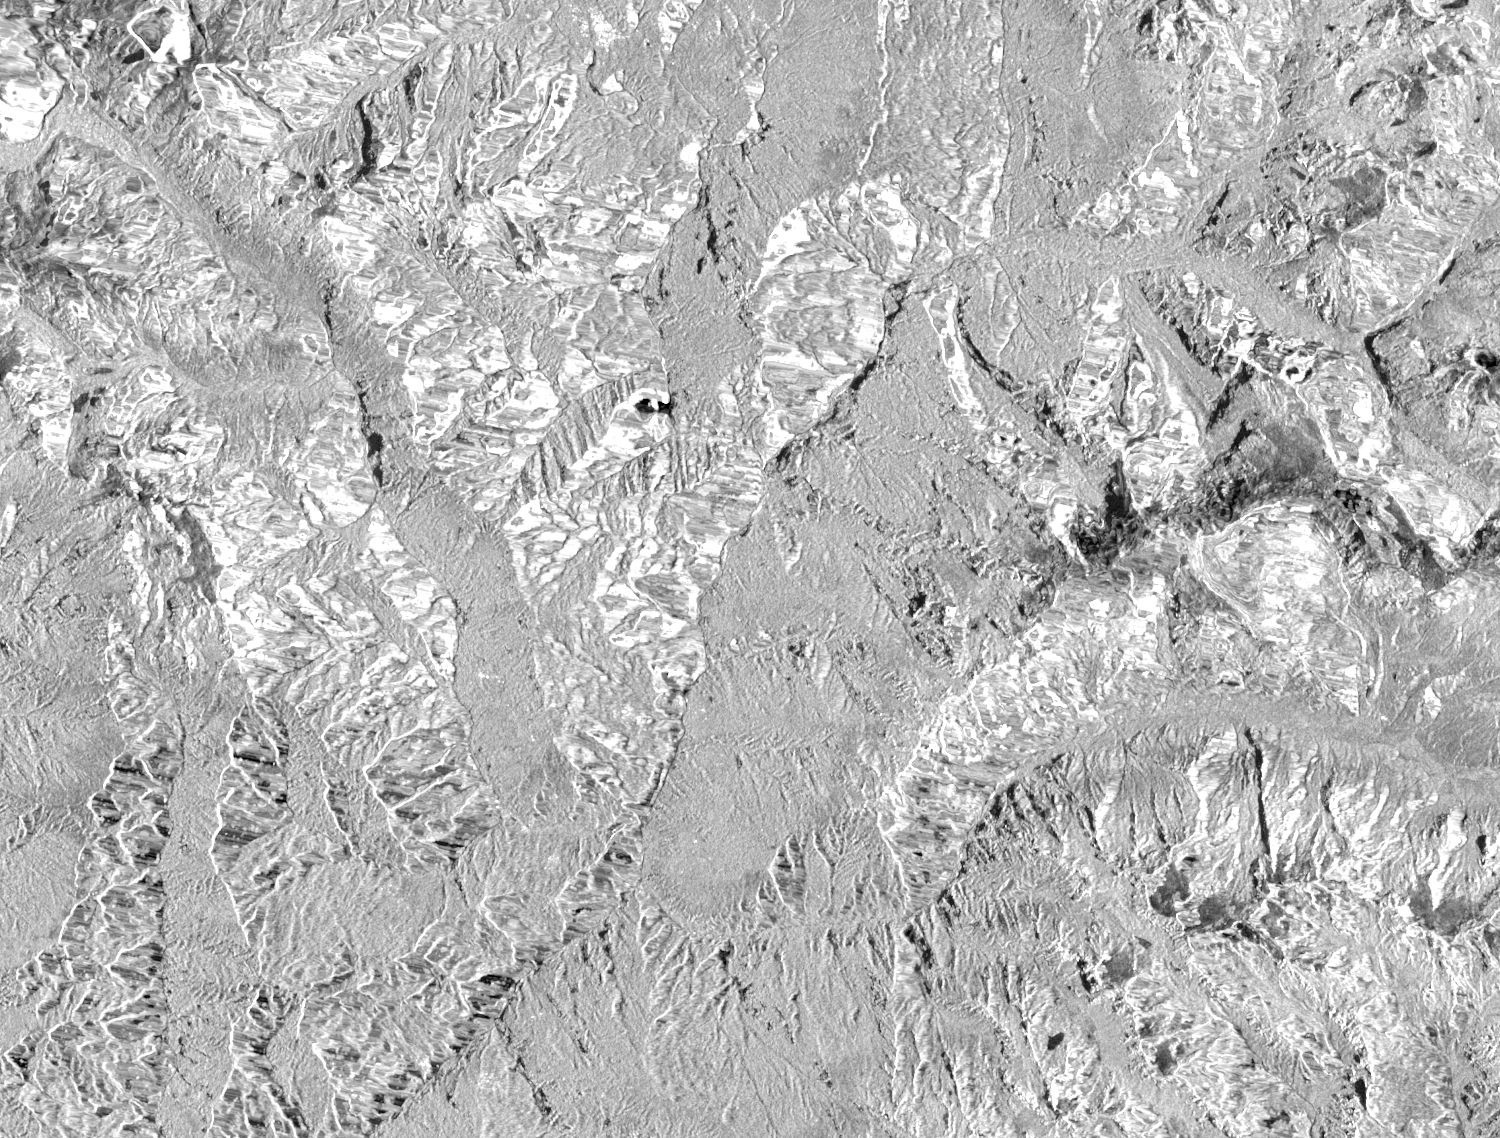 08-12 descending VV
08-24 descending VV
08-12 descending VV
08-24 descending VV
 08-12 descending composite
08-24 descending composite
08-12 descending composite
08-24 descending composite
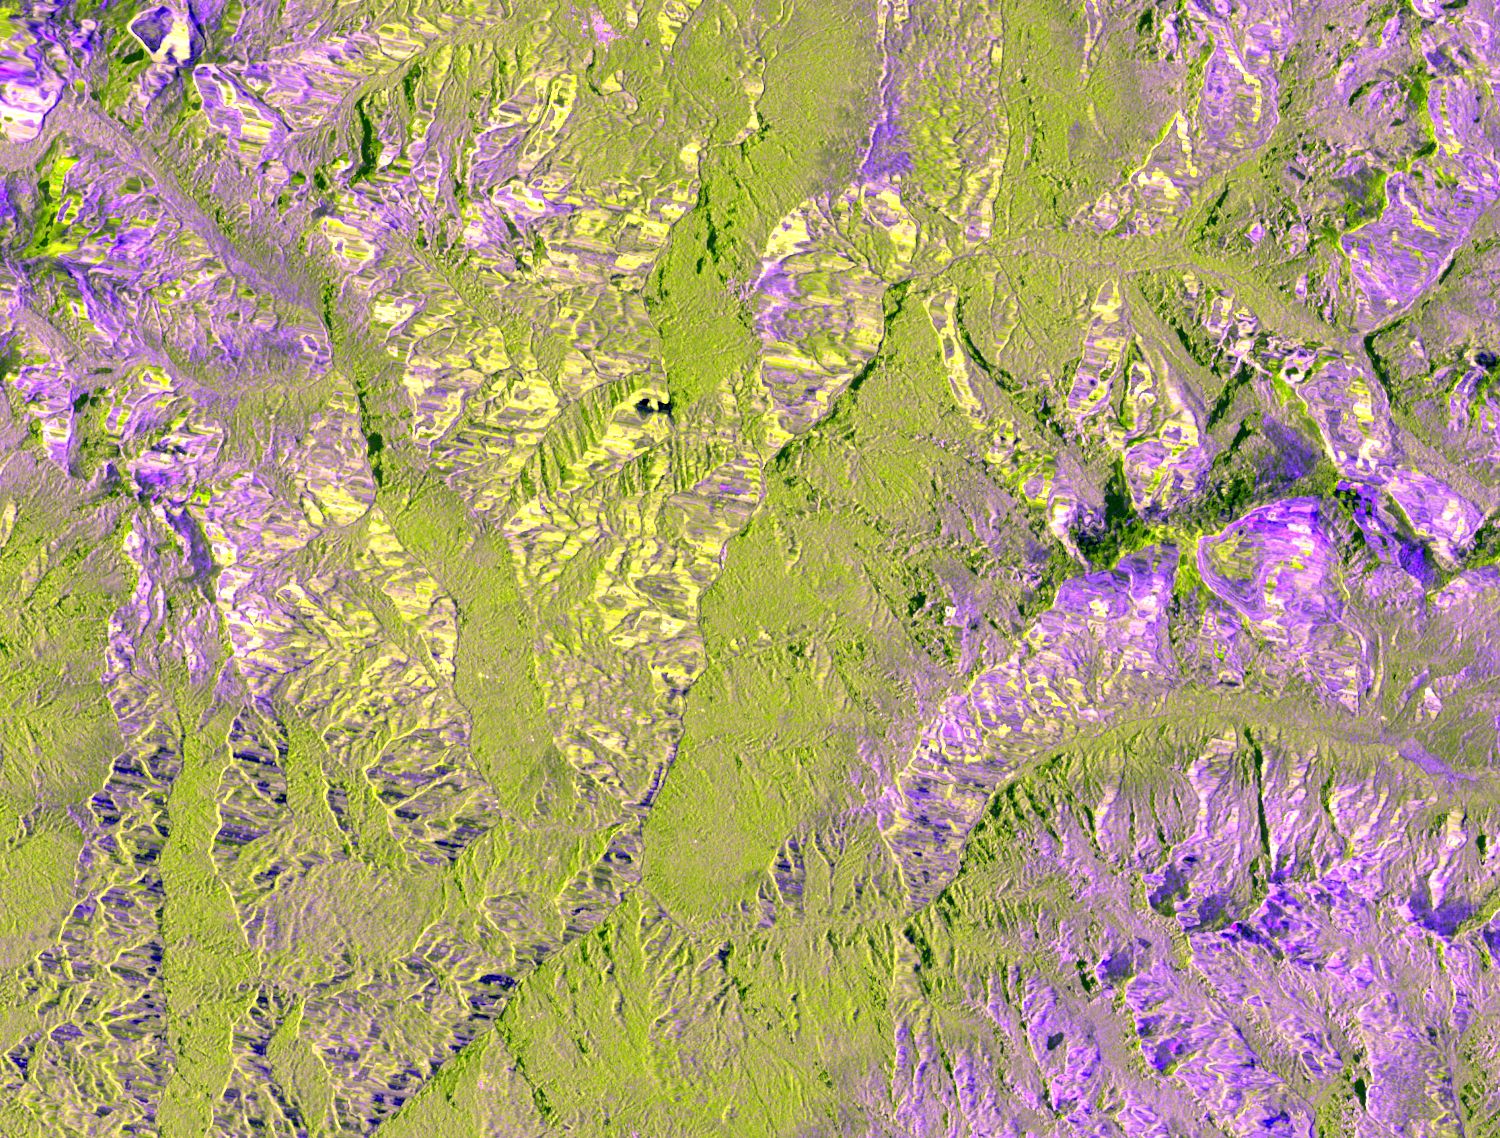
One further constraint: ascending and descending passes have different perspective distortion, and a slope that is in layover under one geometry may be in shadow under the other, so the two cannot be compared pixel by pixel. Every comparison is therefore made within a single track.
The first post-event Sentinel-1 scene (C-band)
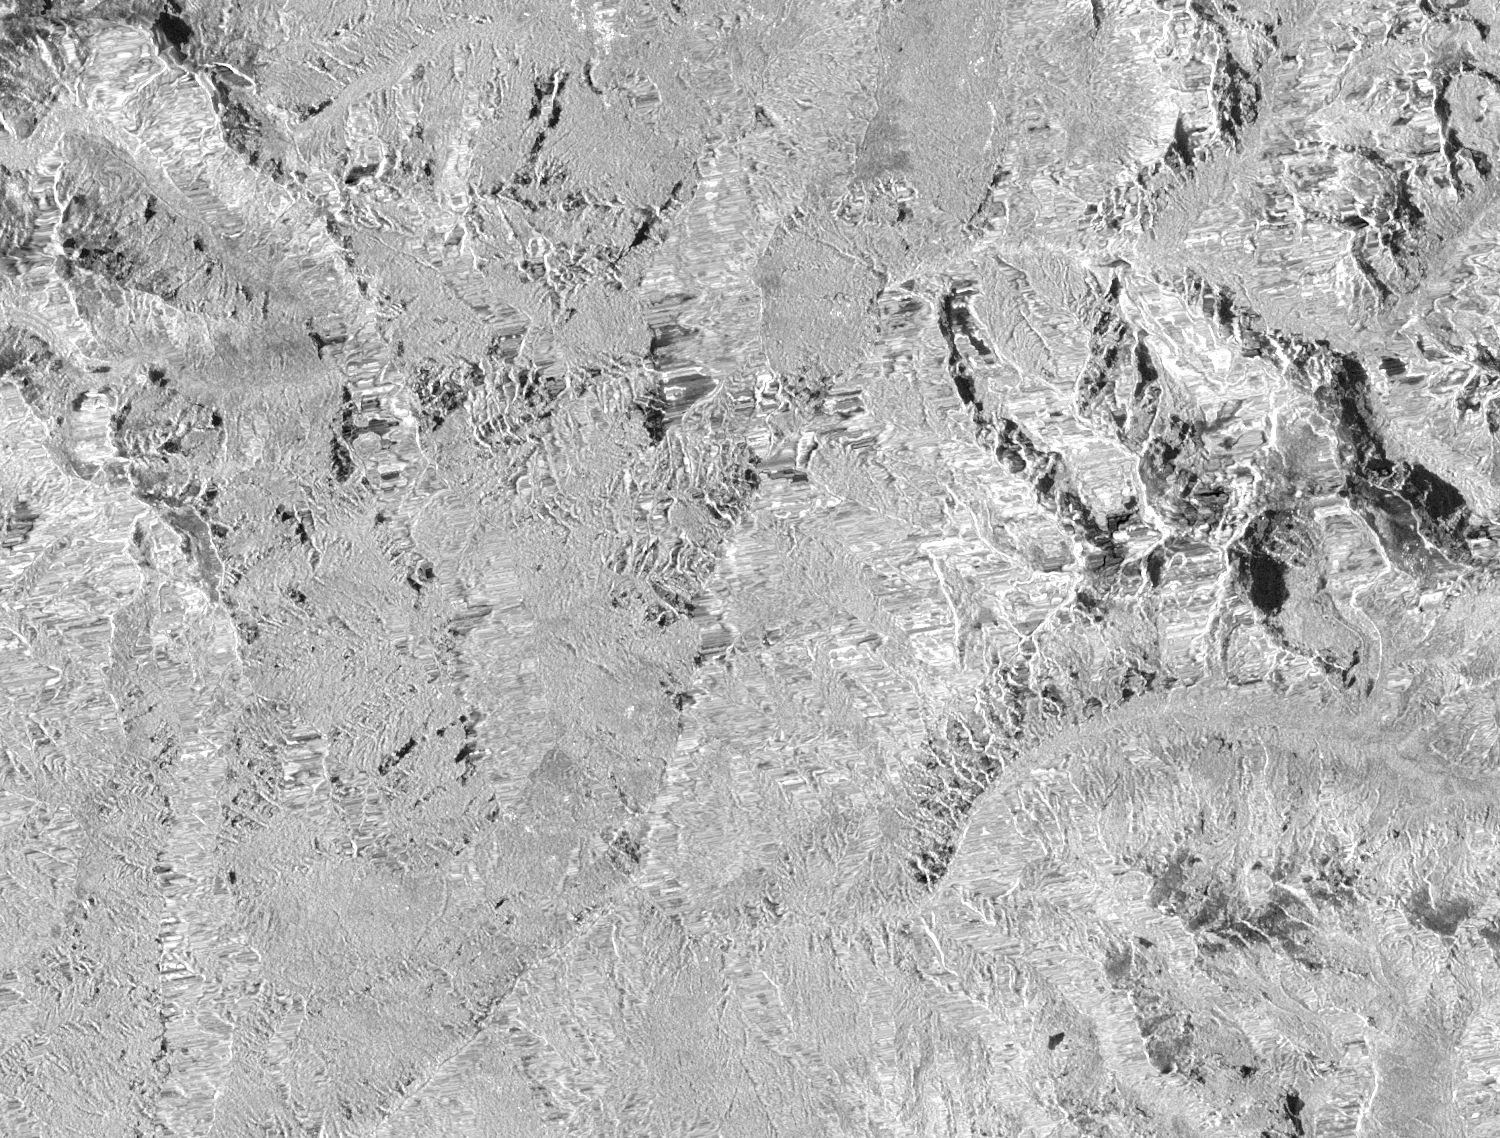
The path 85 ascending post-event scene (acquired 08-28 12:21 UTC) was ingested on 29 August, forming the first cross-event same-track 12-day pair against the 08-16 baseline. It is presented the same way as the pre-event same-track pairs, clipped to the corridor (85.15–85.60°E, 28.10–28.40°N), both dates under the same stretch:
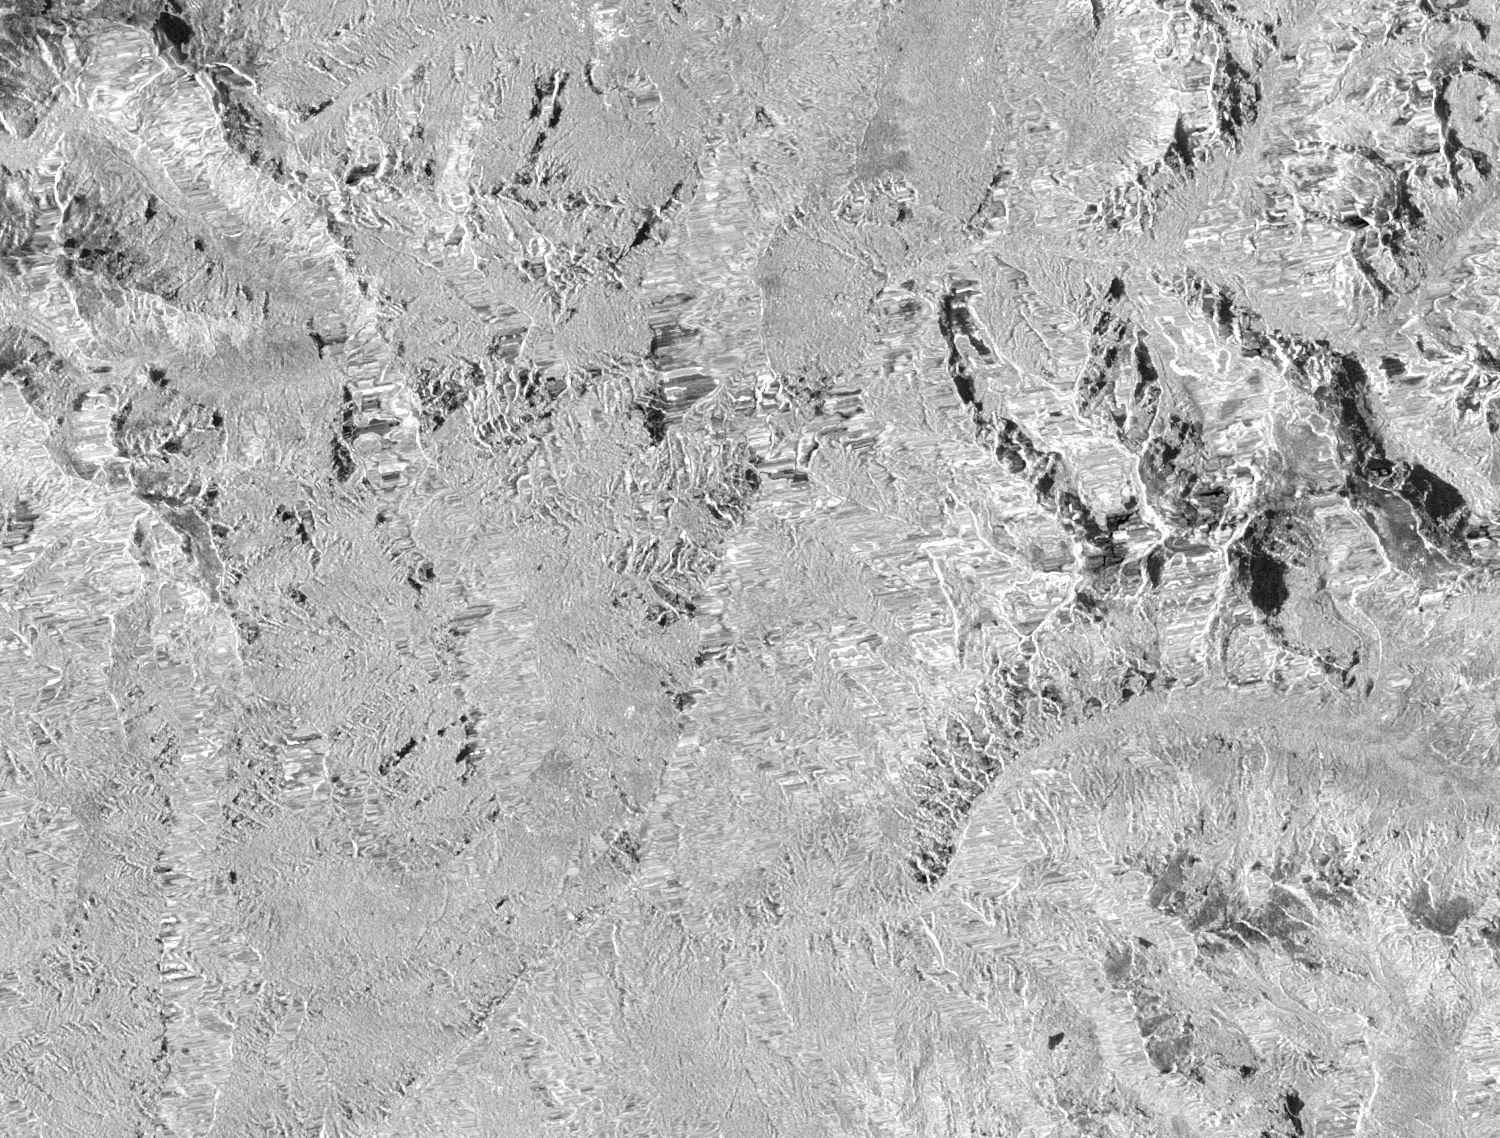 Pre-event 08-16 ascending VV
Post-event 08-28 ascending VV
Pre-event 08-16 ascending VV
Post-event 08-28 ascending VV
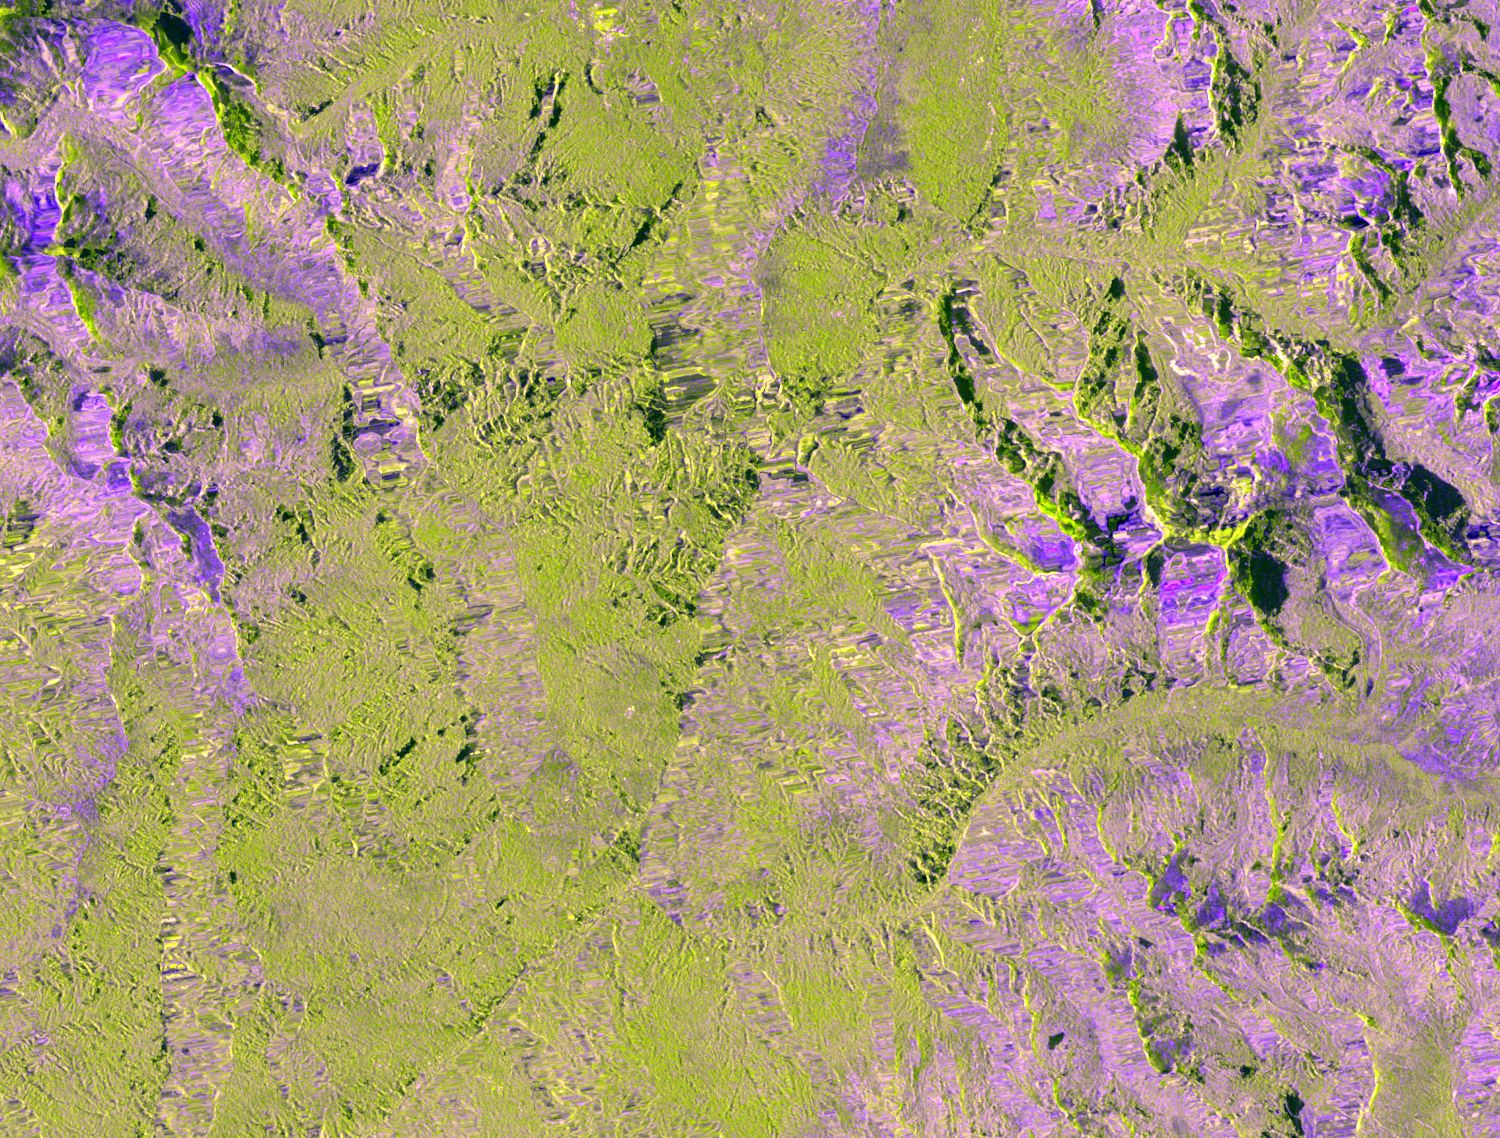 Pre-event 08-16 ascending composite
Post-event 08-28 ascending composite
Pre-event 08-16 ascending composite
Post-event 08-28 ascending composite
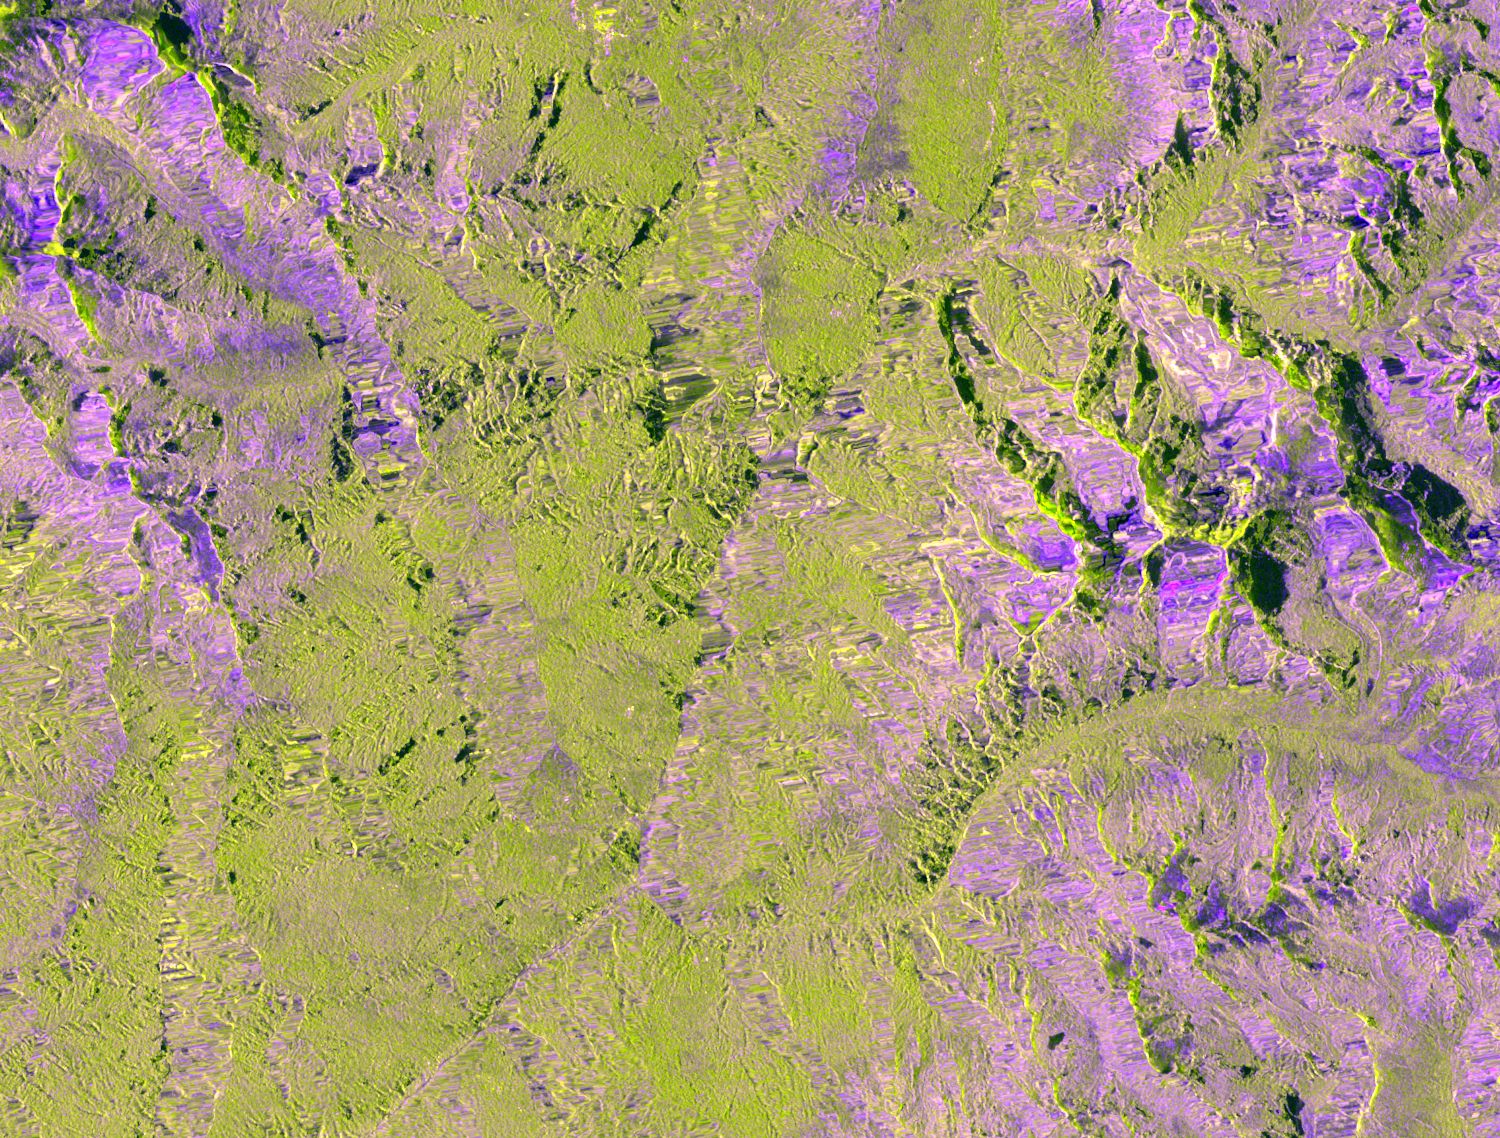
The change-detection procedure is: RTC γ⁰ at 20 m, 5×5 smoothing, ±3 dB threshold, 20,000 m² minimum mapping unit. The noise floor, measured by running the same procedure on the two pre-event same-track pairs in the previous section, is VV 22 and VH 29 km². The cross-event change areas are VV brightening 32.1 / darkening 19.4 km² and VH brightening 23.8 / darkening 15.9 km². Brightening dominates, and the change polygons cluster at high altitude.
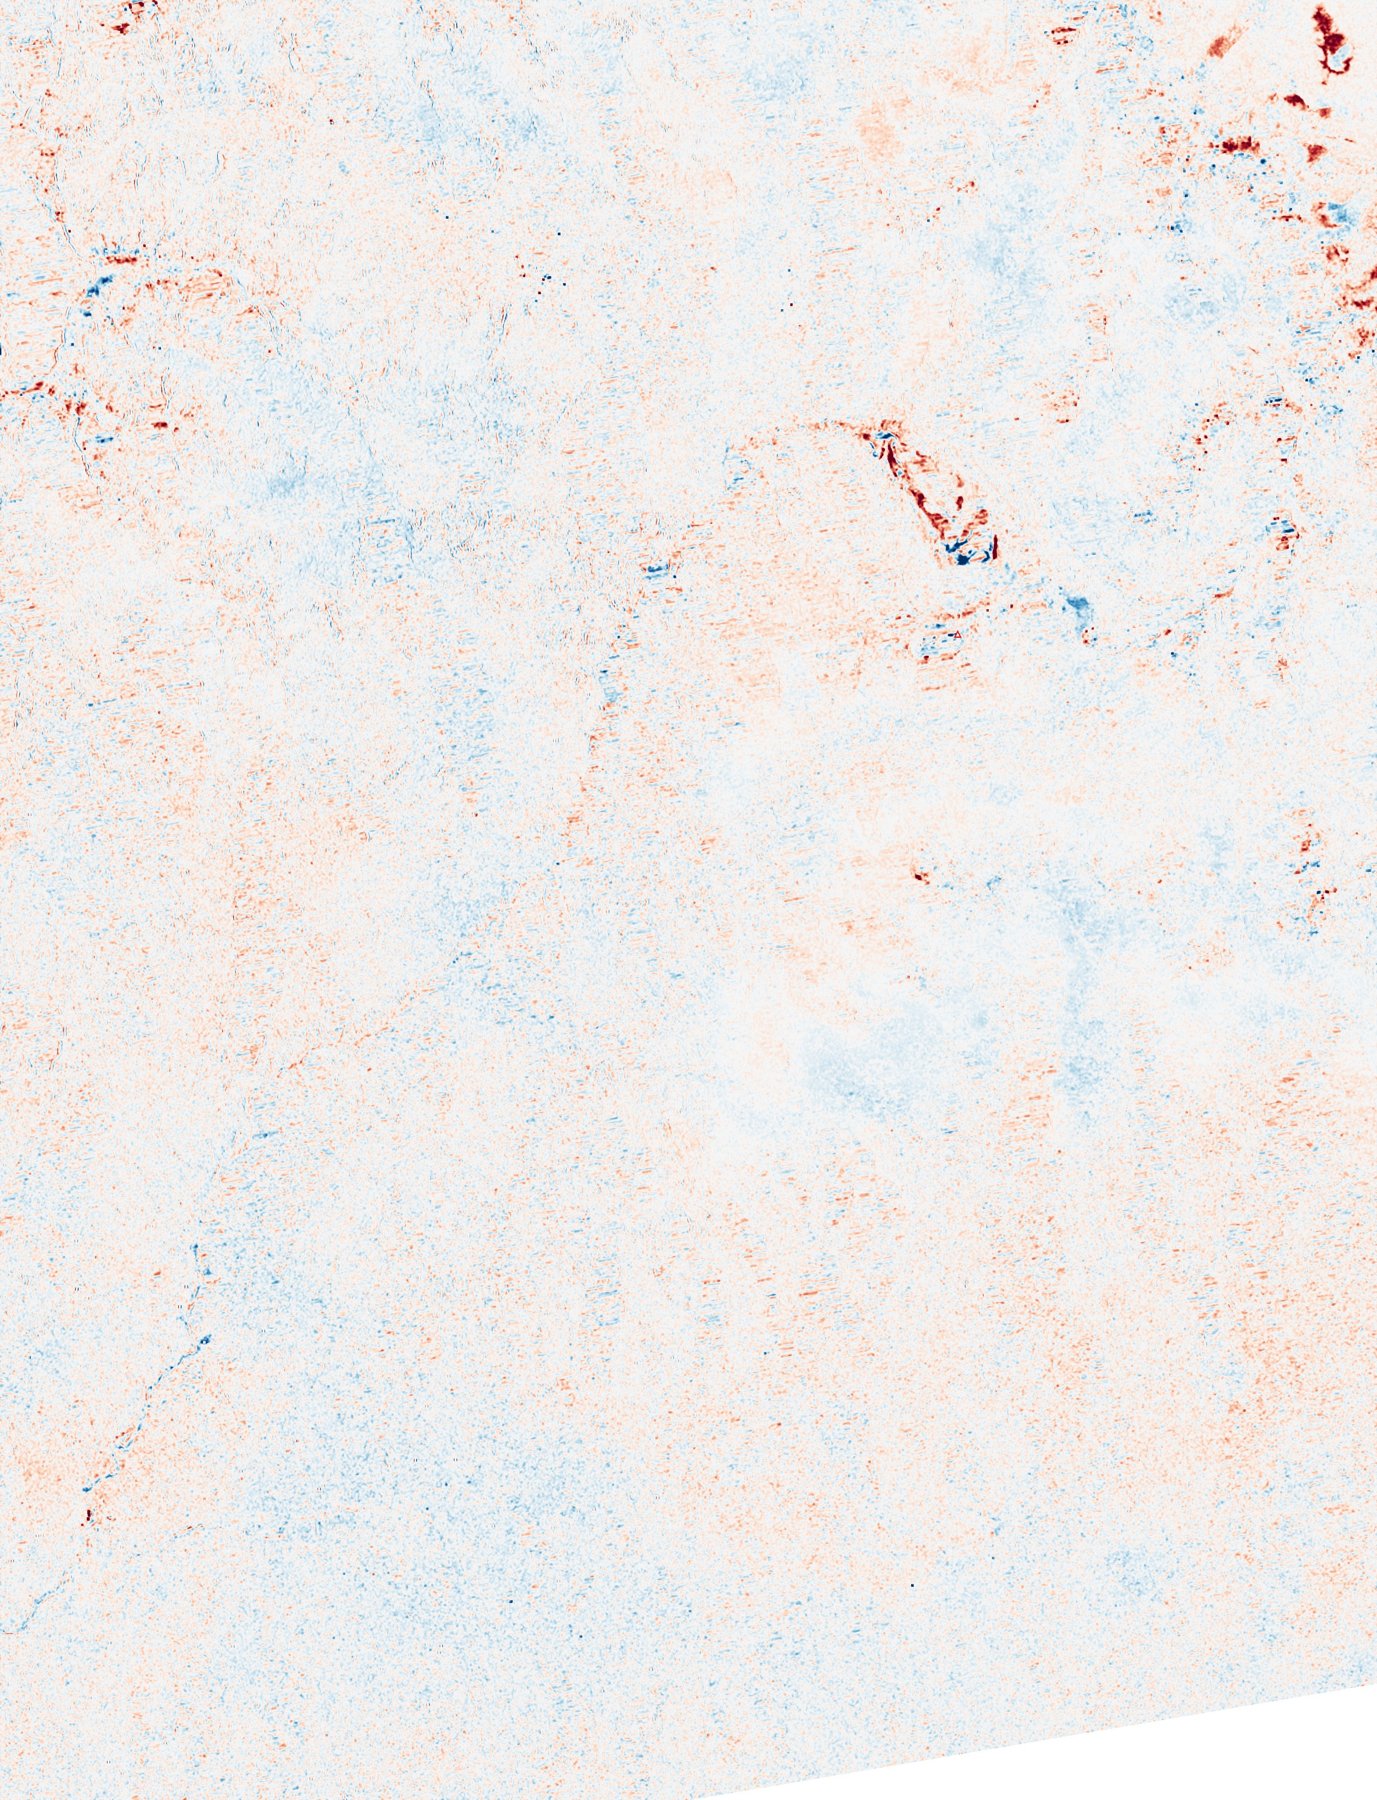
Sentinel-1 path 85 ascending VV amplitude log-ratio, 08-16 to 08-28, RdBu_r colour scale, ±8 dB: red is brightening, blue is darkening; the red triangle marks Langtang Lirung. Full AOI extent (85.09–85.71°E, 27.79–28.51°N), 20 m/px.
In the Lirung glacier basin and the Lende Khola headwaters, 2–6 km north of the peak, there is a grouped set of ±8 dB anomalies: brightening stripes adjacent to patches darkened by more than 8 dB, co-located in both VV and VH. Change density there is 5.6% (VV) and 5.3% (VH), against AOI-wide averages of 1.1% (VV) and 0.84% (VH). Change density along the border-gorge corridor is about 1%.
NISAR post-event data (L-band)
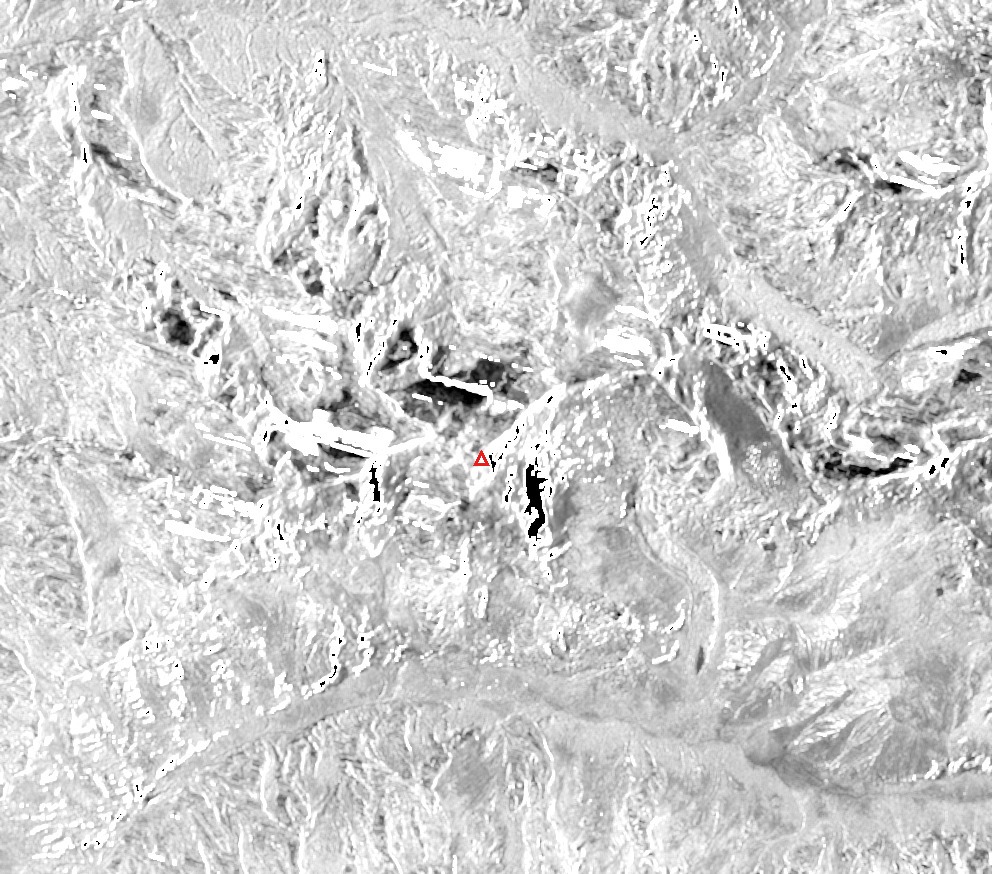
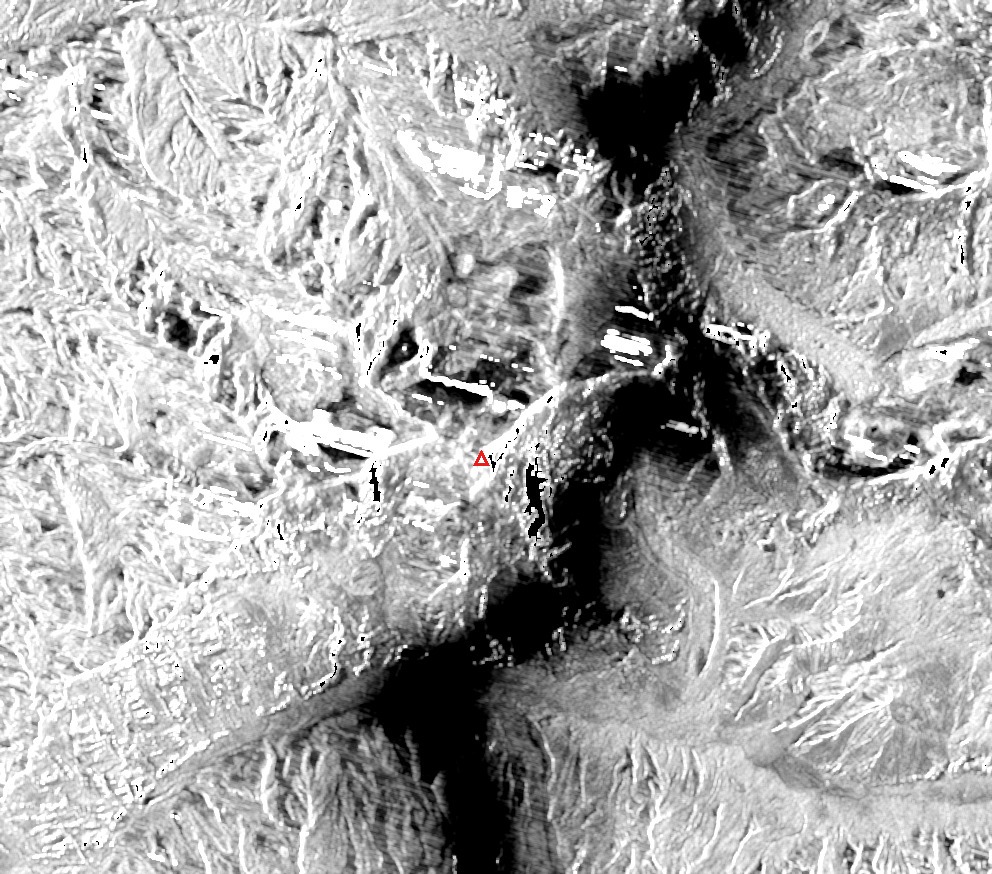
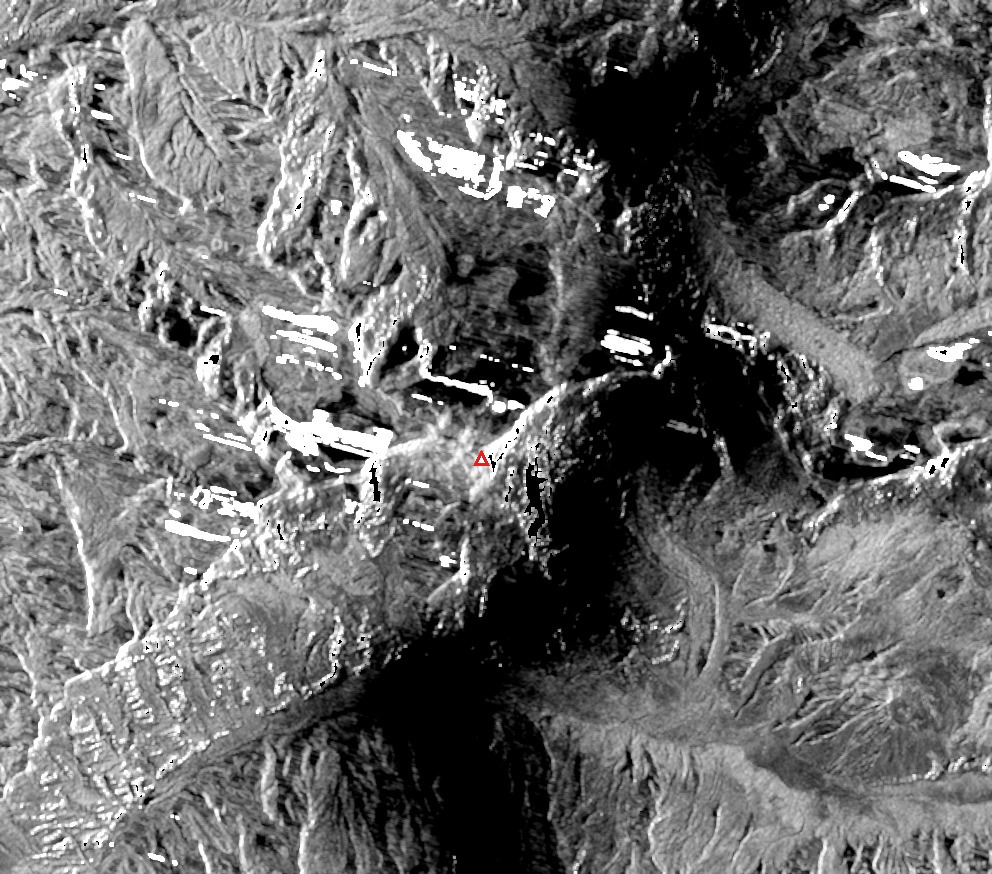
NISAR’s path 48 descending pass acquired a scene at 12:58 UTC on 2026-08-28, about 2.5 days after the main collapse. The Sentinel-1 post-event scene (acquired the same day at 12:21 UTC, previous section) was ingested on 29 August, so this NISAR acquisition was until then the only obtainable post-event SAR. Everything NISAR distributed in 2026 is a provisional product. On the amplitude side one GCOV product covers one scene, and the two ends of this pair come from the two processing streams described above: the pre-event 08-16 scene from the routine stream (_PR_, 4005 DHDH, 10 m) and the post-event 08-28 scene from the urgent-response stream (_UR_, 2005 QPDH, 20 m). On the coherence side one GUNW product covers a whole interferometric pair, and both the cross-event pair used here (08-16 to 08-28) and the 24-day pre-event pair (07-23 to 08-16) come from the routine stream. The amplitude channel of this batch carries a gain artifact of about 10 dB in the range direction, confirmed against pre-event amplitude profiles. No amplitude difference is used below; the three measures shown are unaffected by the artifact: the change in polarisation ratio, cross-event correlation, and the change in interferometric coherence.
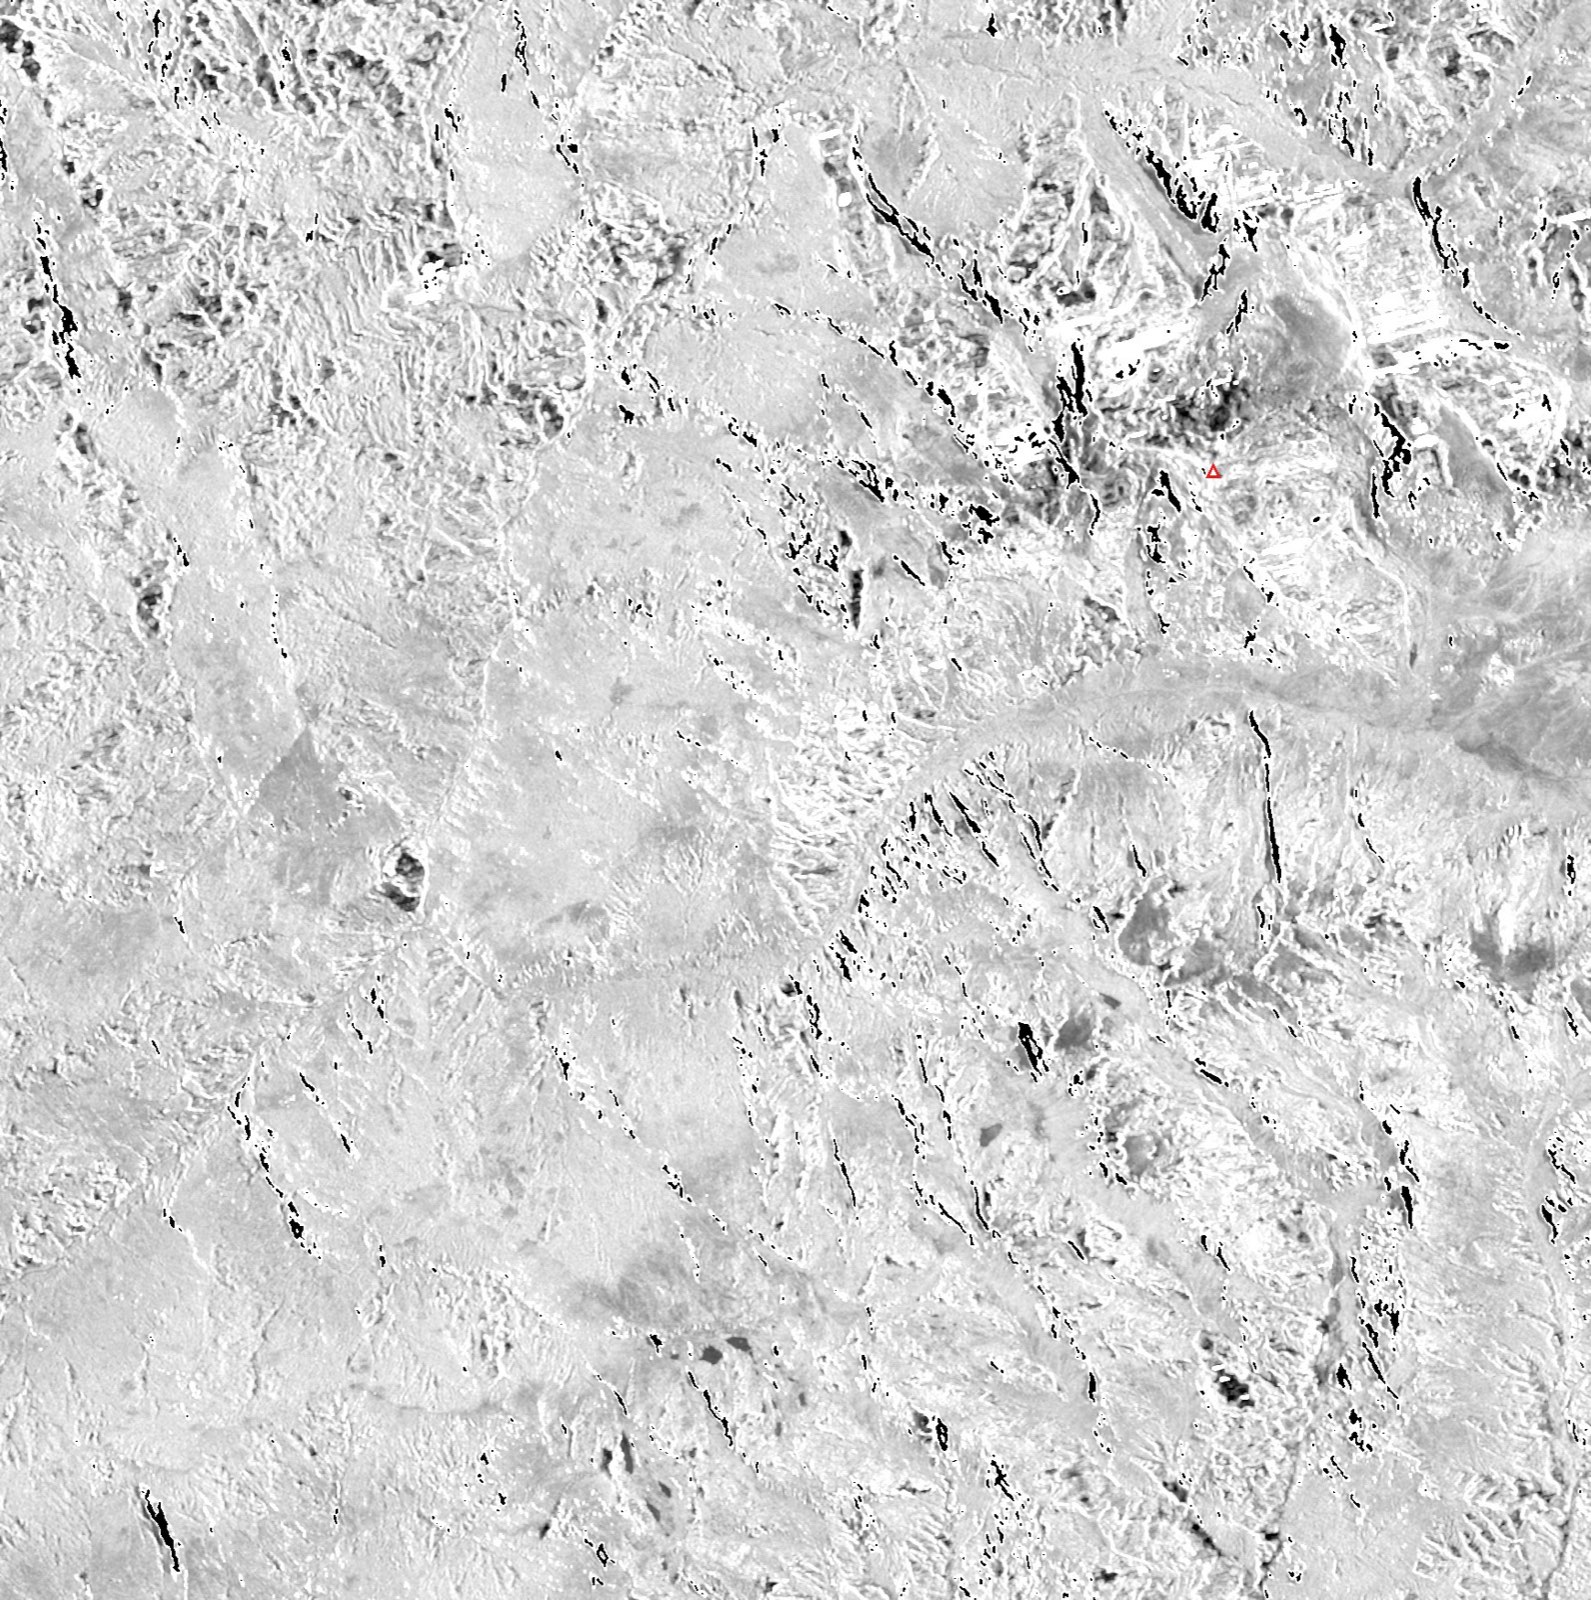
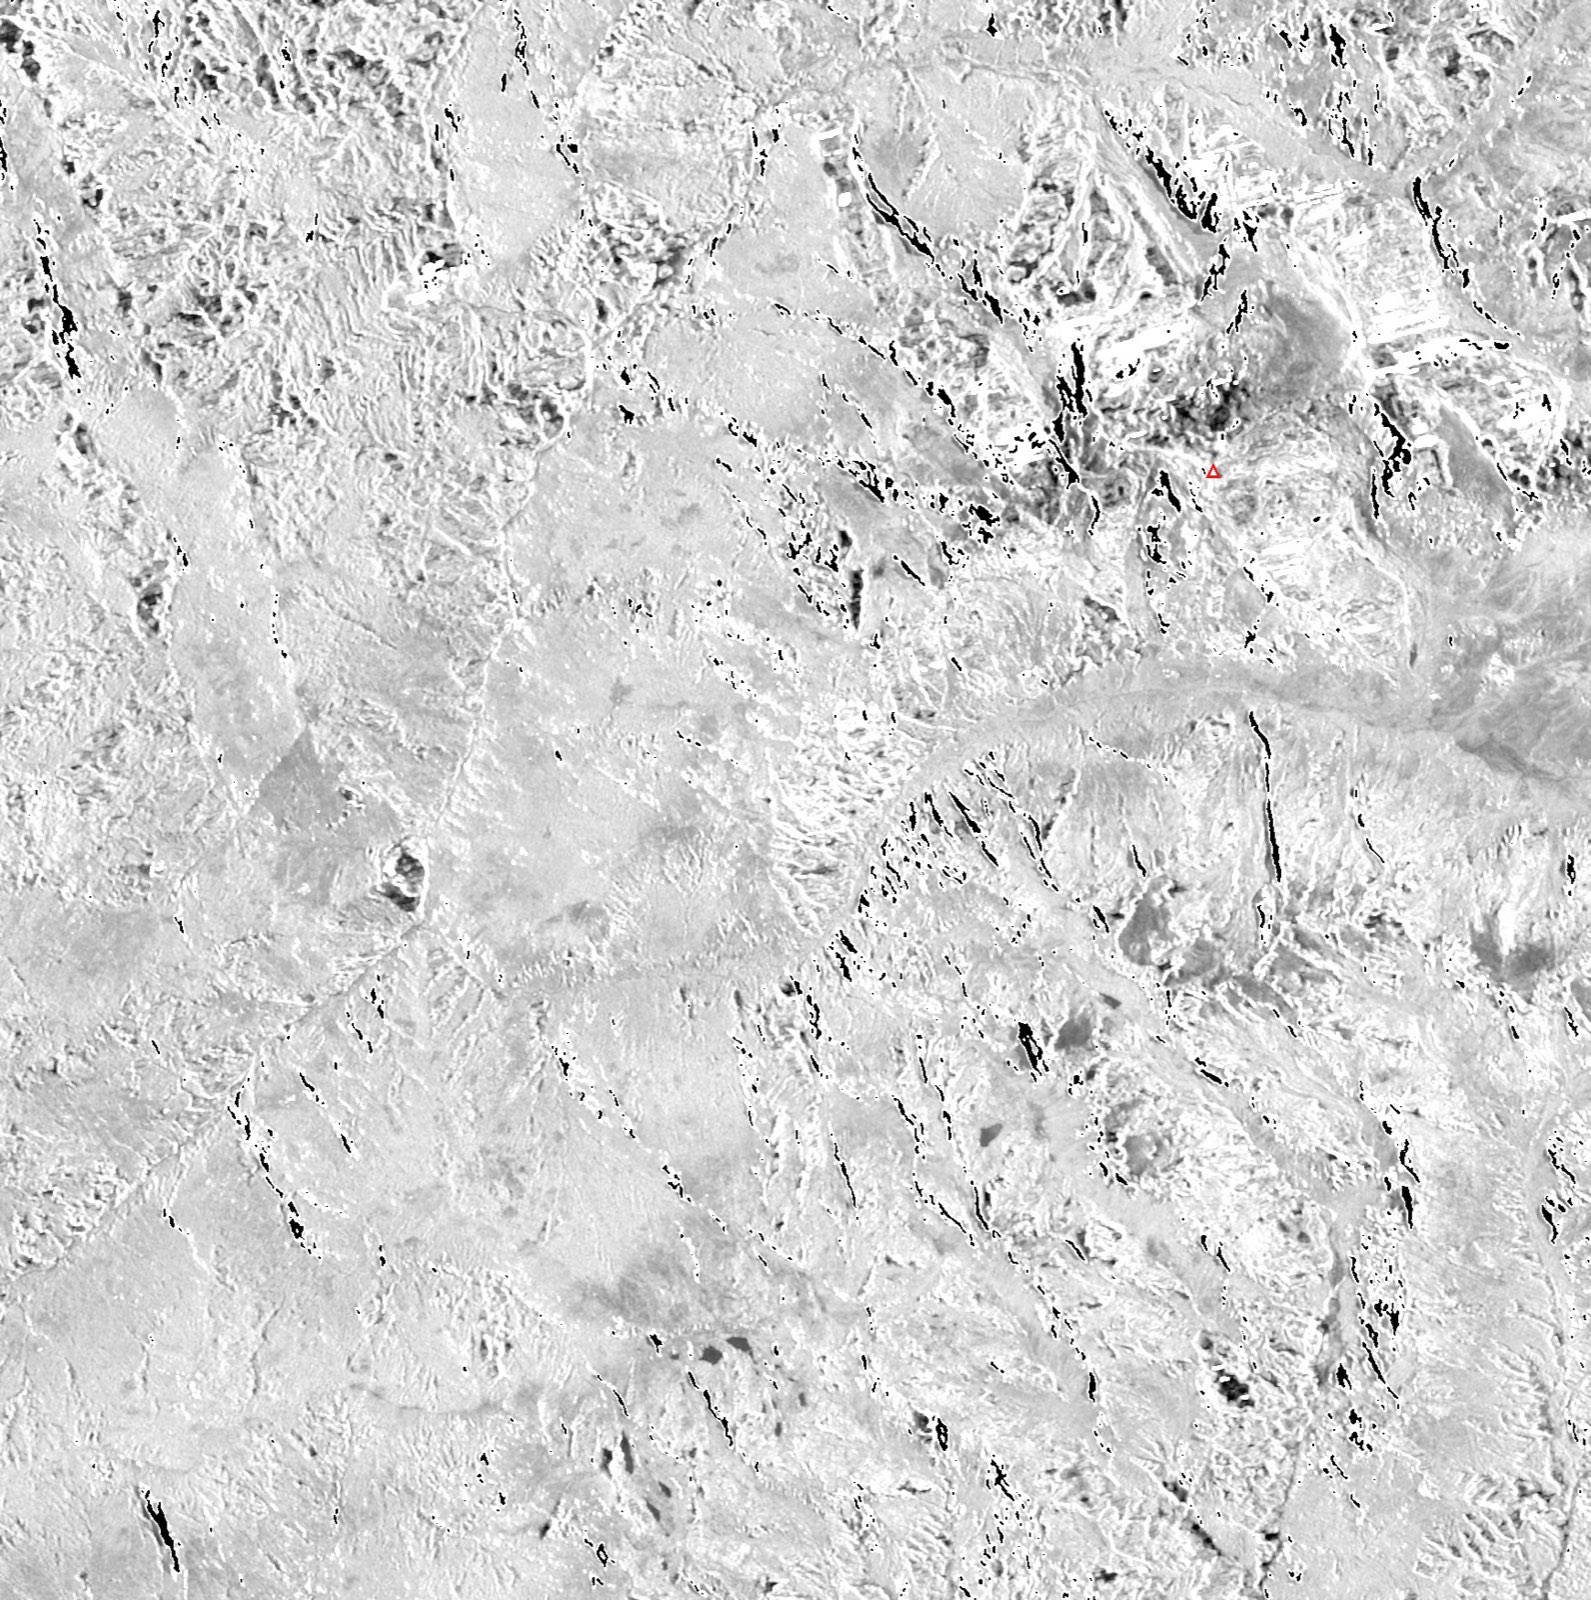
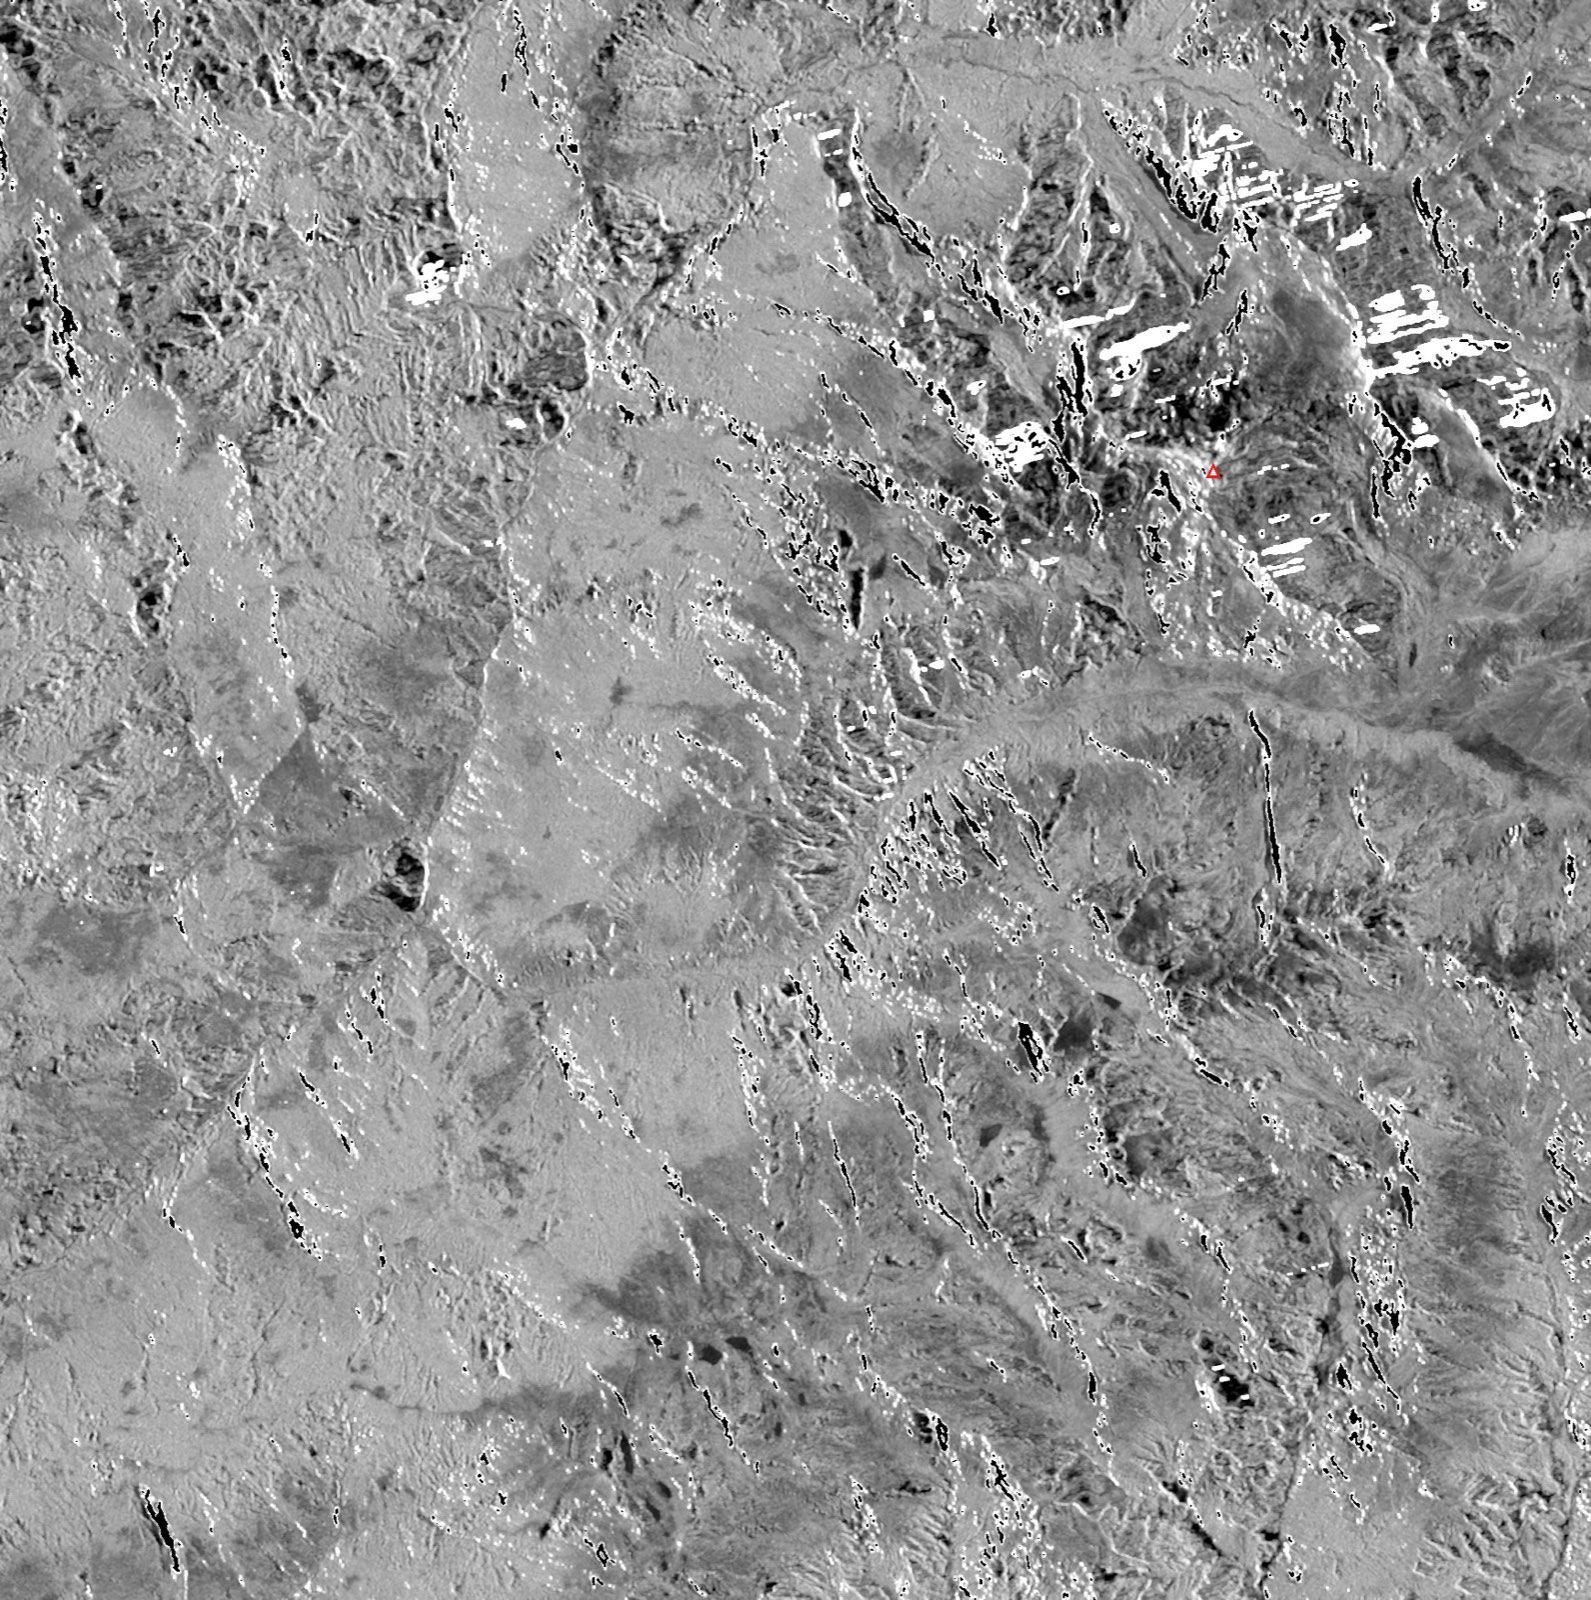
The clip window is 85.42–85.62°E, 28.18–28.34°N, north up, smaller than the Sentinel-1 corridor clips above; Langtang Lirung sits near the centre of the frame at 85.517°E, 28.256°N, and is marked with a red triangle in each image below.
 Pre-event 08-16 HH
Post-event 08-28 HH
Pre-event 08-16 HH
Post-event 08-28 HH
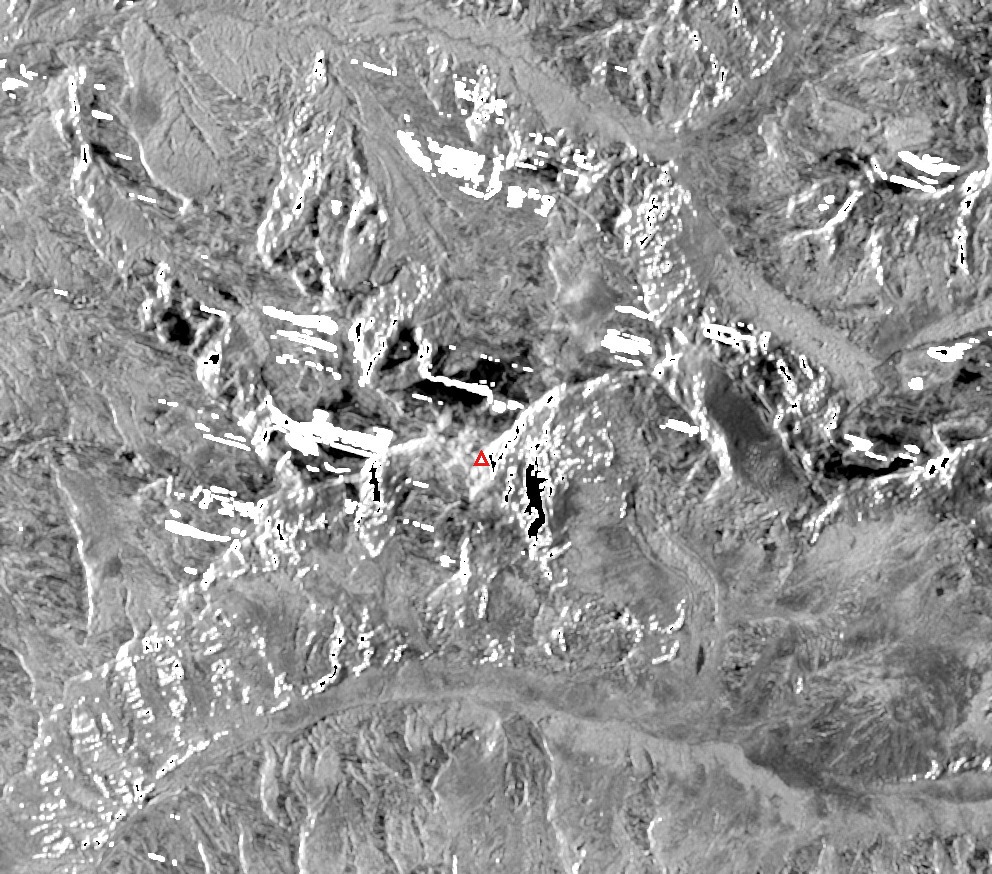 Pre-event 08-16 HV
Post-event 08-28 HV
Pre-event 08-16 HV
Post-event 08-28 HV
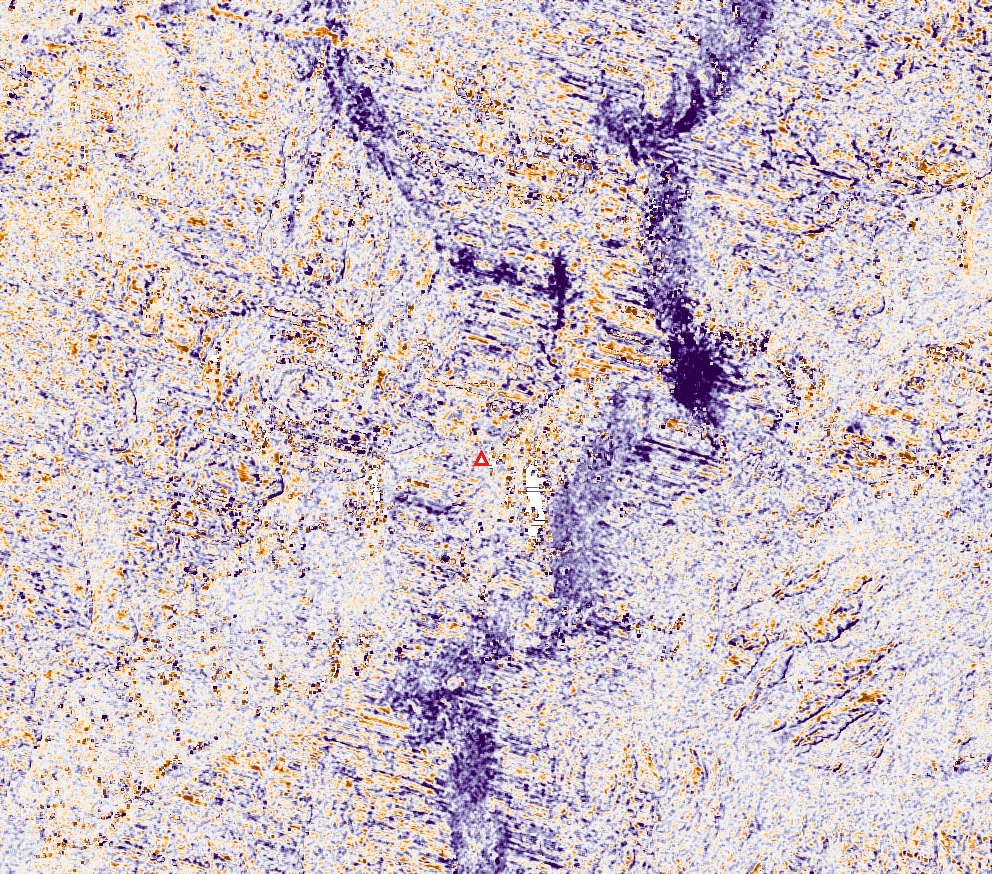
Change in polarisation ratio Δ(HV−HH), 08-16 to 08-28, PuOr_r colour scale, ±6 dB: purple is a decrease in depolarisation, orange an increase. The purple runs as continuous bands along the Lende Khola valley north of Langtang Lirung and the upper Langtang valley, with a further cluster of anomalies northeast of the peak. 20 m/px.
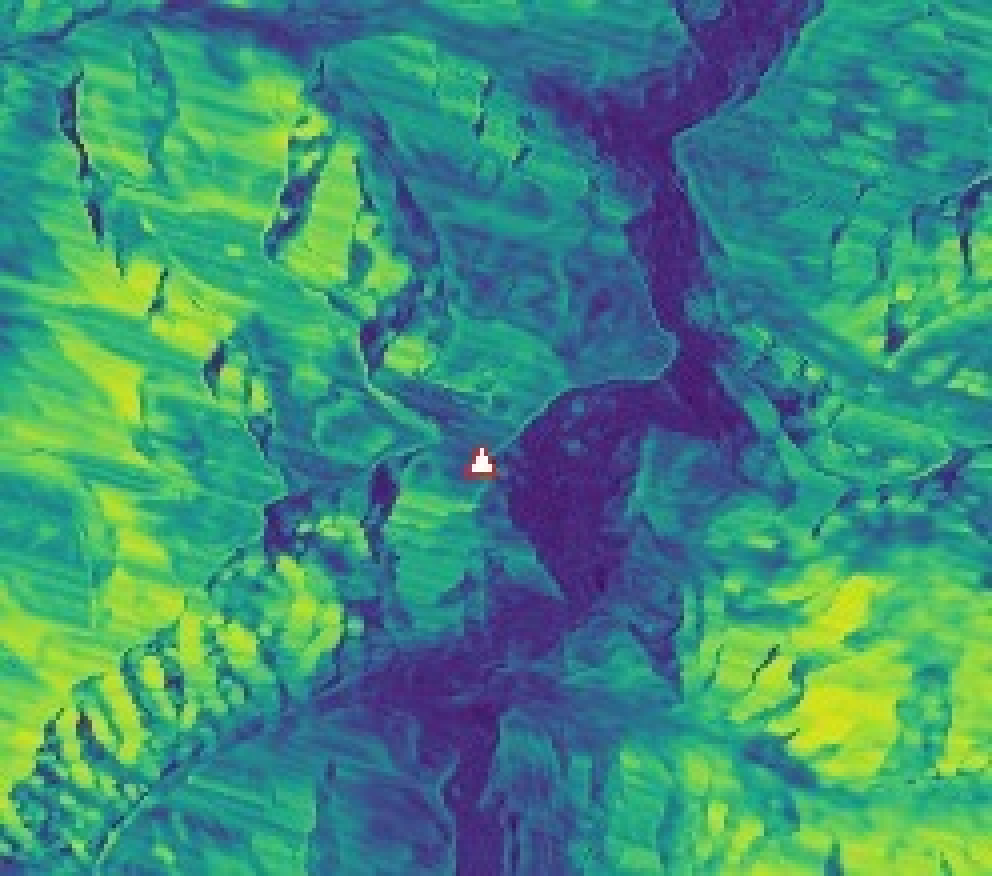
Correlation peak of cross-event pixel offsets, viridis colour scale, 0–1: dark areas are decorrelated, where the pre- and post-event image texture cannot be matched. A continuous low-correlation corridor follows the drainage from the massif northward across the full window and extends south; 23% of the window area has a correlation peak below 0.2. Native resolution 80 m/px, shown at 4× nearest-neighbour upscaling.
Offset values inside the low-correlation areas are unreliable, so no offset map is shown. In the cross-event interferometric pair (08-16 to 08-28), valley floors that stay coherent in the 24-day pre-event pair (07-23 to 08-16) decorrelate over large areas (28% of pixels lose more than 0.2 in coherence), with a footprint co-located with the low-correlation corridor above.
Analysis boxes and valley-floor stratification
The five sections that follow all report statistics inside a fixed set of analysis boxes:
| Box | Longitude | Latitude |
|---|---|---|
| source | 85.47–85.56°E | 28.24–28.31°N |
| corridor | 85.30–85.42°E | 28.10–28.32°N |
| port_reach | 85.36–85.42°E | 28.24–28.30°N |
| timure_syabru | 85.31–85.40°E | 28.14–28.24°N |
| below_syabru | 85.25–85.34°E | 28.05–28.15°N |
| reach_upper | 85.10–85.23°E | 27.88–28.00°N |
| reach_lower | 84.85–85.10°E | 27.70–27.90°N |
| offriver_control | 85.24–85.34°E | 27.84–27.96°N |
| tibet_snow_ctl | 85.58–85.70°E | 28.38–28.51°N |
port_reach, timure_syabru and below_syabru are three segments of corridor; reach_upper and reach_lower sit on the Trishuli; offriver_control is a control box off the river in the same latitude band; tibet_snow_ctl lies north of the divide on the Tibetan side. Langtang Lirung is at 85.517°E, 28.256°N.
Box density is the fraction of valid pixels inside a box flagged as changed (brightening and darkening merged), divided by the same fraction over the full AOI of that scene; the denominator comes from the valid pixels of the log-ratio raster. Box densities from different tracks are comparable only after the two scenes’ denominators are aligned to a common footprint. Boxes with valid coverage below 0.60 are not reported.
Valley-floor stratification uses Copernicus DEM GLO-30: a pixel within 40 m of the local 2 km minimum is valley floor, everything else is hillslope. The stratified quantity is the fraction of valley-floor pixels flagged as changed, divided by the same fraction over hillslope pixels. The source box contains no valley-floor pixels (its lowest pixel sits 46 m above the local 2 km minimum), so the source zone is not stratified.
Every cross-event pair is paired with a pre-event control pair on the same track, spanning an interval with no event in it. Coherence loss is the interferometric coherence of the cross-event pair minus the coherence of a reference pair; the temporal baseline of the reference is given in each section.
The following points apply to every SAR statistic in this post:
- The pre-event control pairs span 12 days, with one 24-day reference for the downstream coherence noted in its section; what they constrain is ordinary monsoon variability. Whether a separate anomalous regional flood peak in late August 2026 produced the same valley-floor decrease along the same reaches would take a precipitation record (IMERG/GPM) to establish, and no precipitation data is used here.
- The amplitude decrease is confined to the channel. Smooth water surfaces also backscatter weakly, so the measure is equally consistent with fresh debris fill, with channel widening, and with water cover; no deposit area is given here.
- The thickness of the debris remaining in the valley cannot be measured from these data, and no thickness figure is given.
- Cross-geometry and cross-track agreement ratios state only that two datasets flag change in the same places; they carry nothing about cause.
- Valley-floor pixels are themselves biased: river stage, moisture and floodplain crops all change backscatter, and the pre-event control pairs already darken more on the downstream valley floor than on the hillslopes. The control rows of the tables below give that baseline.
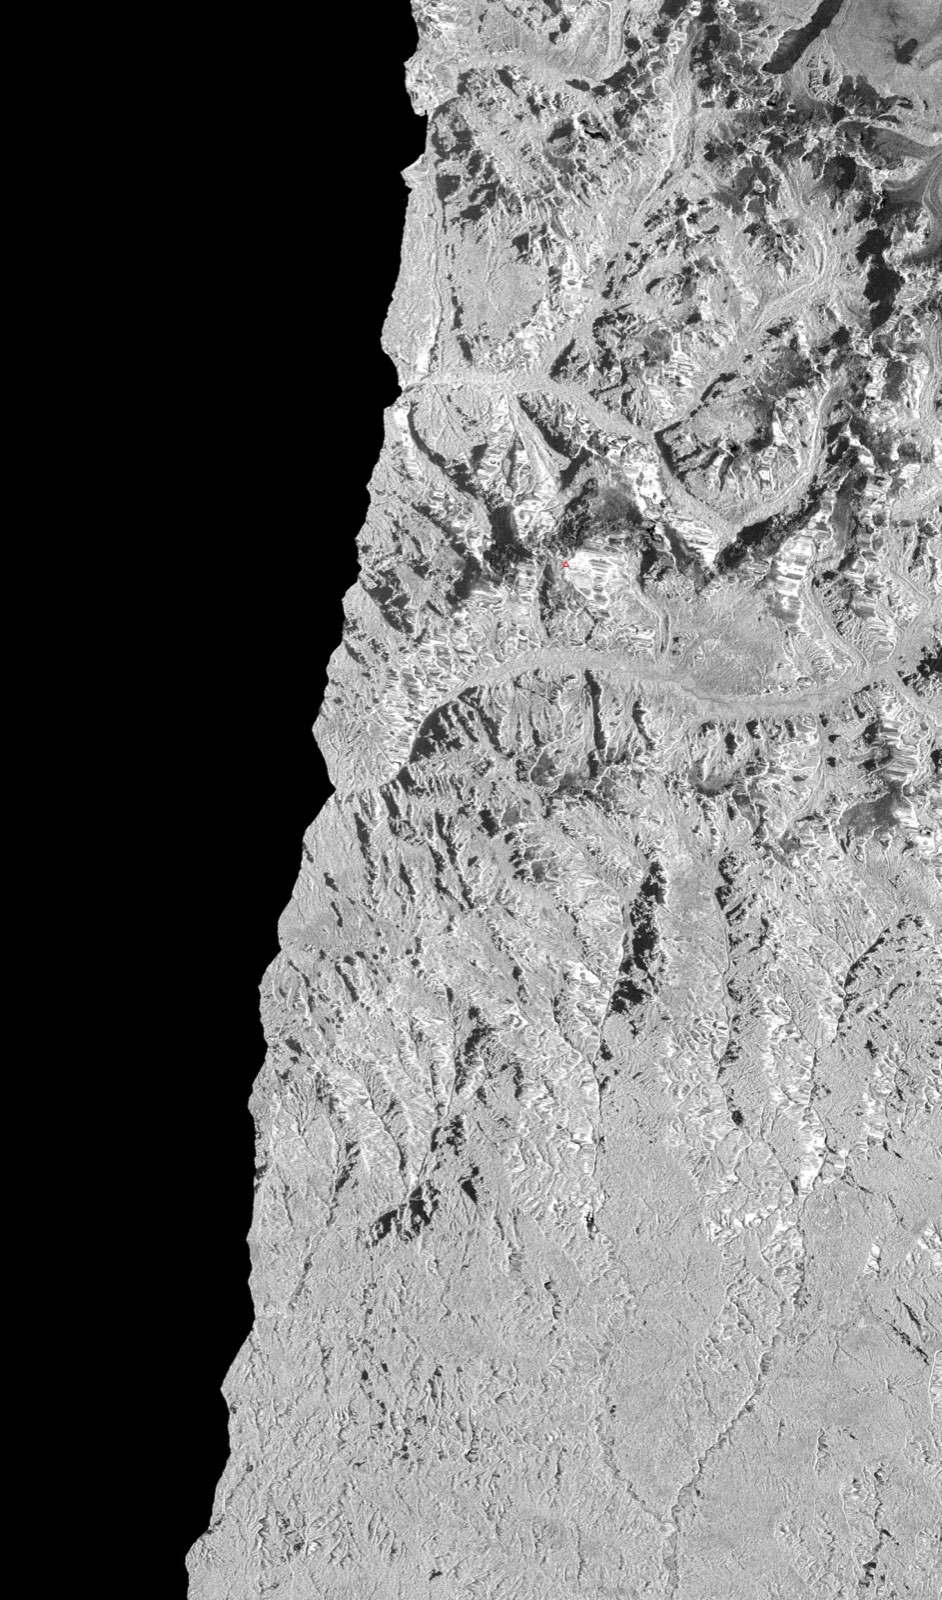
Sentinel-1 path 121 descending post-event scene (C-band)
The path 121 descending post-event scene was acquired 08-31 00:10 UTC and forms a 12-day pair with the 08-19 pre-event scene, the second descending geometry. Valid coverage per box is: source and tibet_snow_ctl 100%, corridor 16% (46.9 km² of 293.5 km²), port_reach 11%, timure_syabru 4%, below_syabru 0%. Within the corridor box the valid pixels fall in these longitude bands: 0% over 85.30–85.36°E, 4.5% over 85.36–85.39°E, 58.7% over 85.39–85.42°E. The corridor and downstream boxes all fall below the 0.60 coverage threshold, so this section reads only source and tibet_snow_ctl.
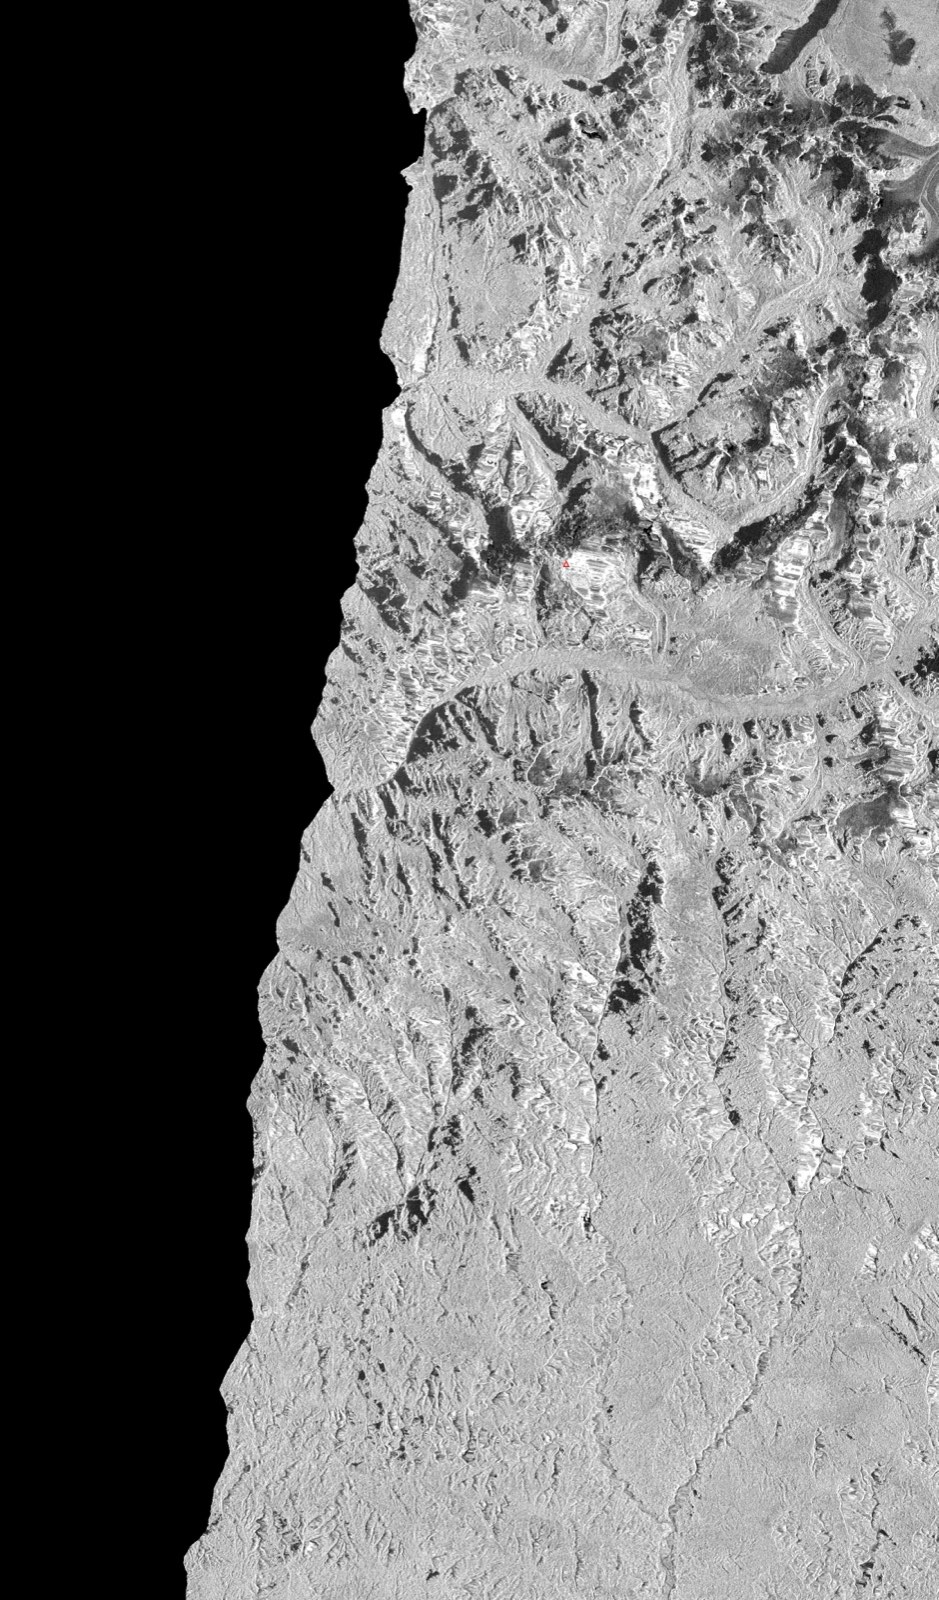 Pre-event 08-19 descending VV
Post-event 08-31 descending VV
Pre-event 08-19 descending VV
Post-event 08-31 descending VV
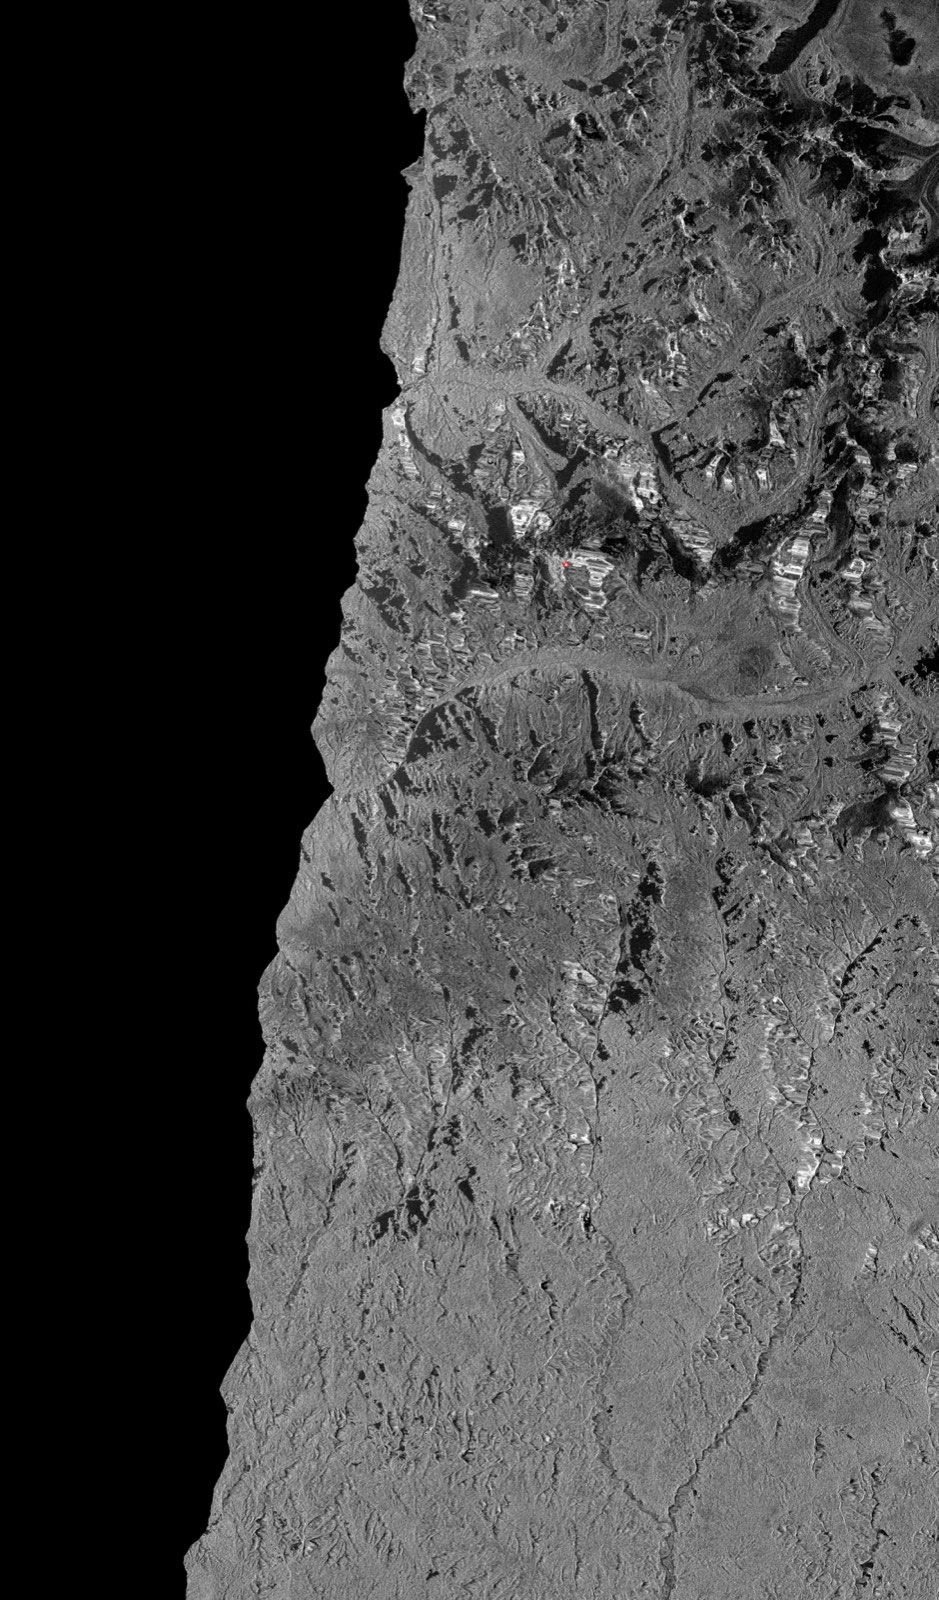 Pre-event 08-19 descending VH
Post-event 08-31 descending VH
Pre-event 08-19 descending VH
Post-event 08-31 descending VH
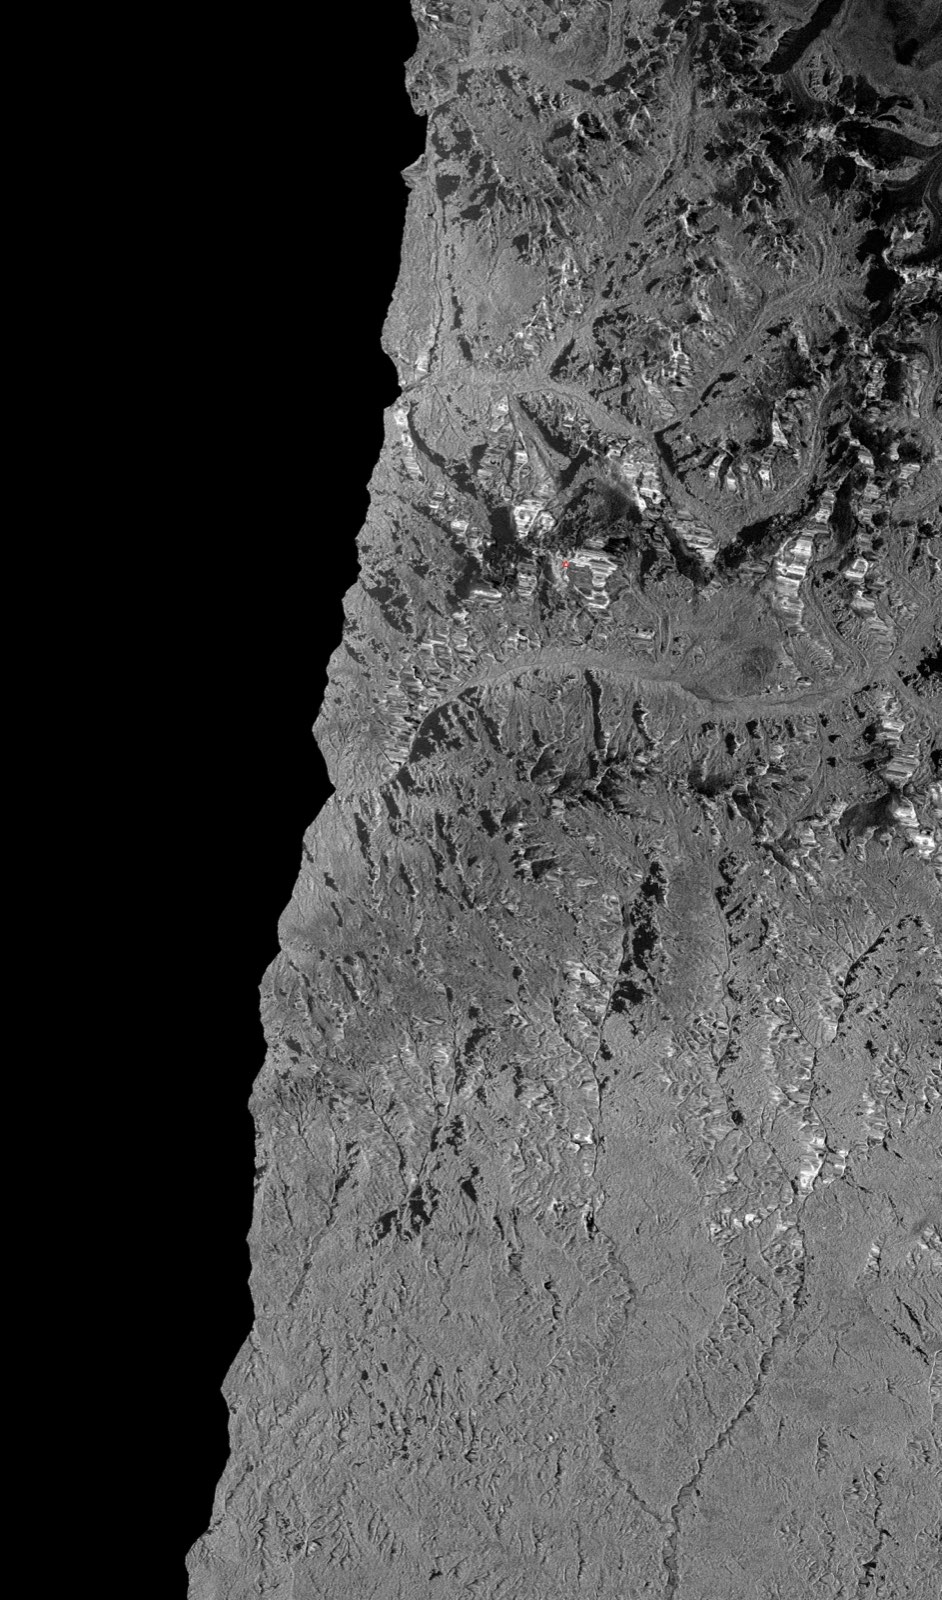
Change areas are VV darkening 29.78 / brightening 14.77 km² across 244 polygons, and VH darkening 22.90 / brightening 9.82 km² across 174 polygons.
Aligned to the footprint shared with the path 85 cross-event pair (2330 km²), the box densities of the two pairs are: source box, path 85 VV 4.87× and VH 6.45×, path 121 VV 2.35× and VH 1.70×; tibet_snow_ctl box, path 85 VV 4.67× and VH 4.77×, path 121 VV 5.51× and VH 7.02×. The fraction of darkened pixels in the Tibetan-side control box is VV 9.15% and VH 9.01% for path 121, against VV 0.97% and VH 0.60% for path 85 in the same box.
Cross-track agreement against the path 85 cross-event pair as reference: source box VV darkening 7.48×, VH darkening 8.54×; tibet_snow_ctl box 1.24× and 2.29×. For scale, the same ratio computed between the VV and VH channels of a single pair (path 85 against itself) is 86× in the source box, 58× in the corridor box and 36× in the Tibetan-side control box.
Sentinel-1 path 19 descending post-event scene (C-band)
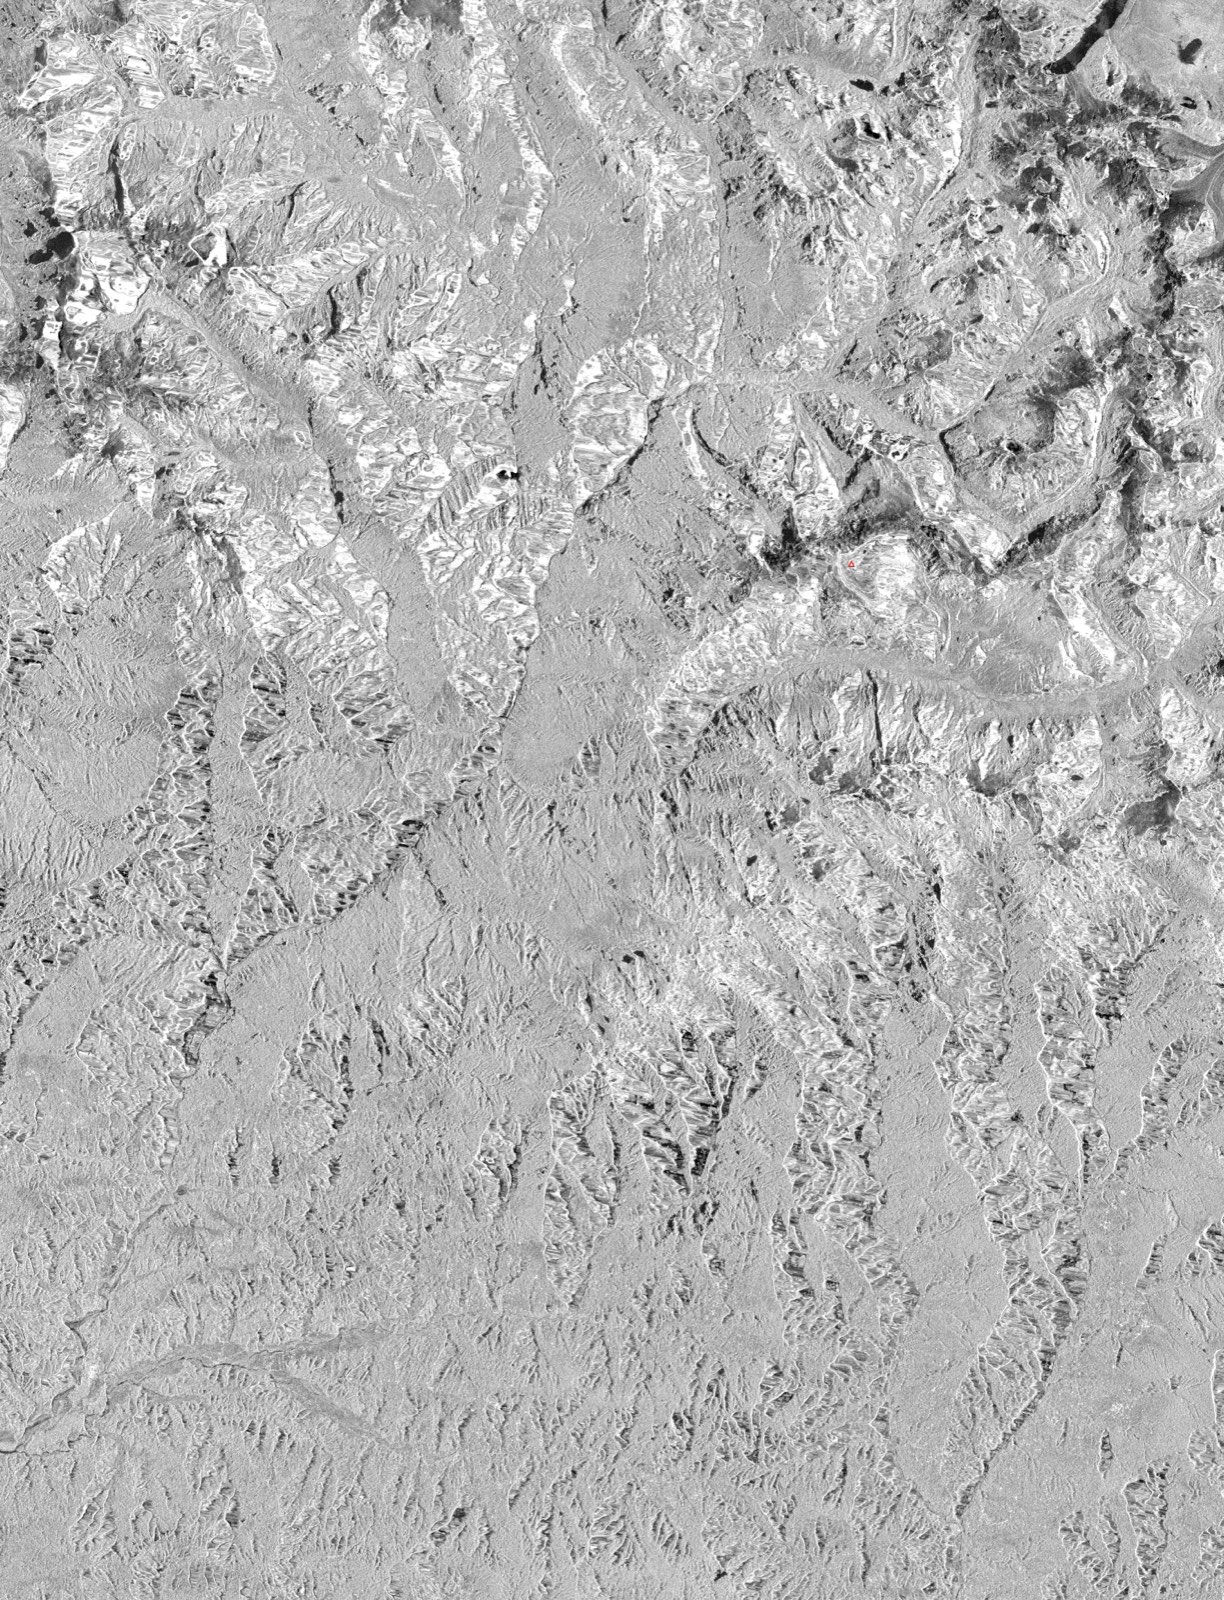
The path 19 descending post-event scene was acquired 09-05 00:18 UTC and forms a 12-day pair with the 08-24 pre-event scene. The 08-24 scene sits 2.1 days before the event, the closest pre-event image on any track; the post-event scene sits 10.0 days after it. Both scenes cover 100% of the AOI, including the peak, the border crossing, Timure, Syabrubesi, Betrawati and Trishuli Bazar.
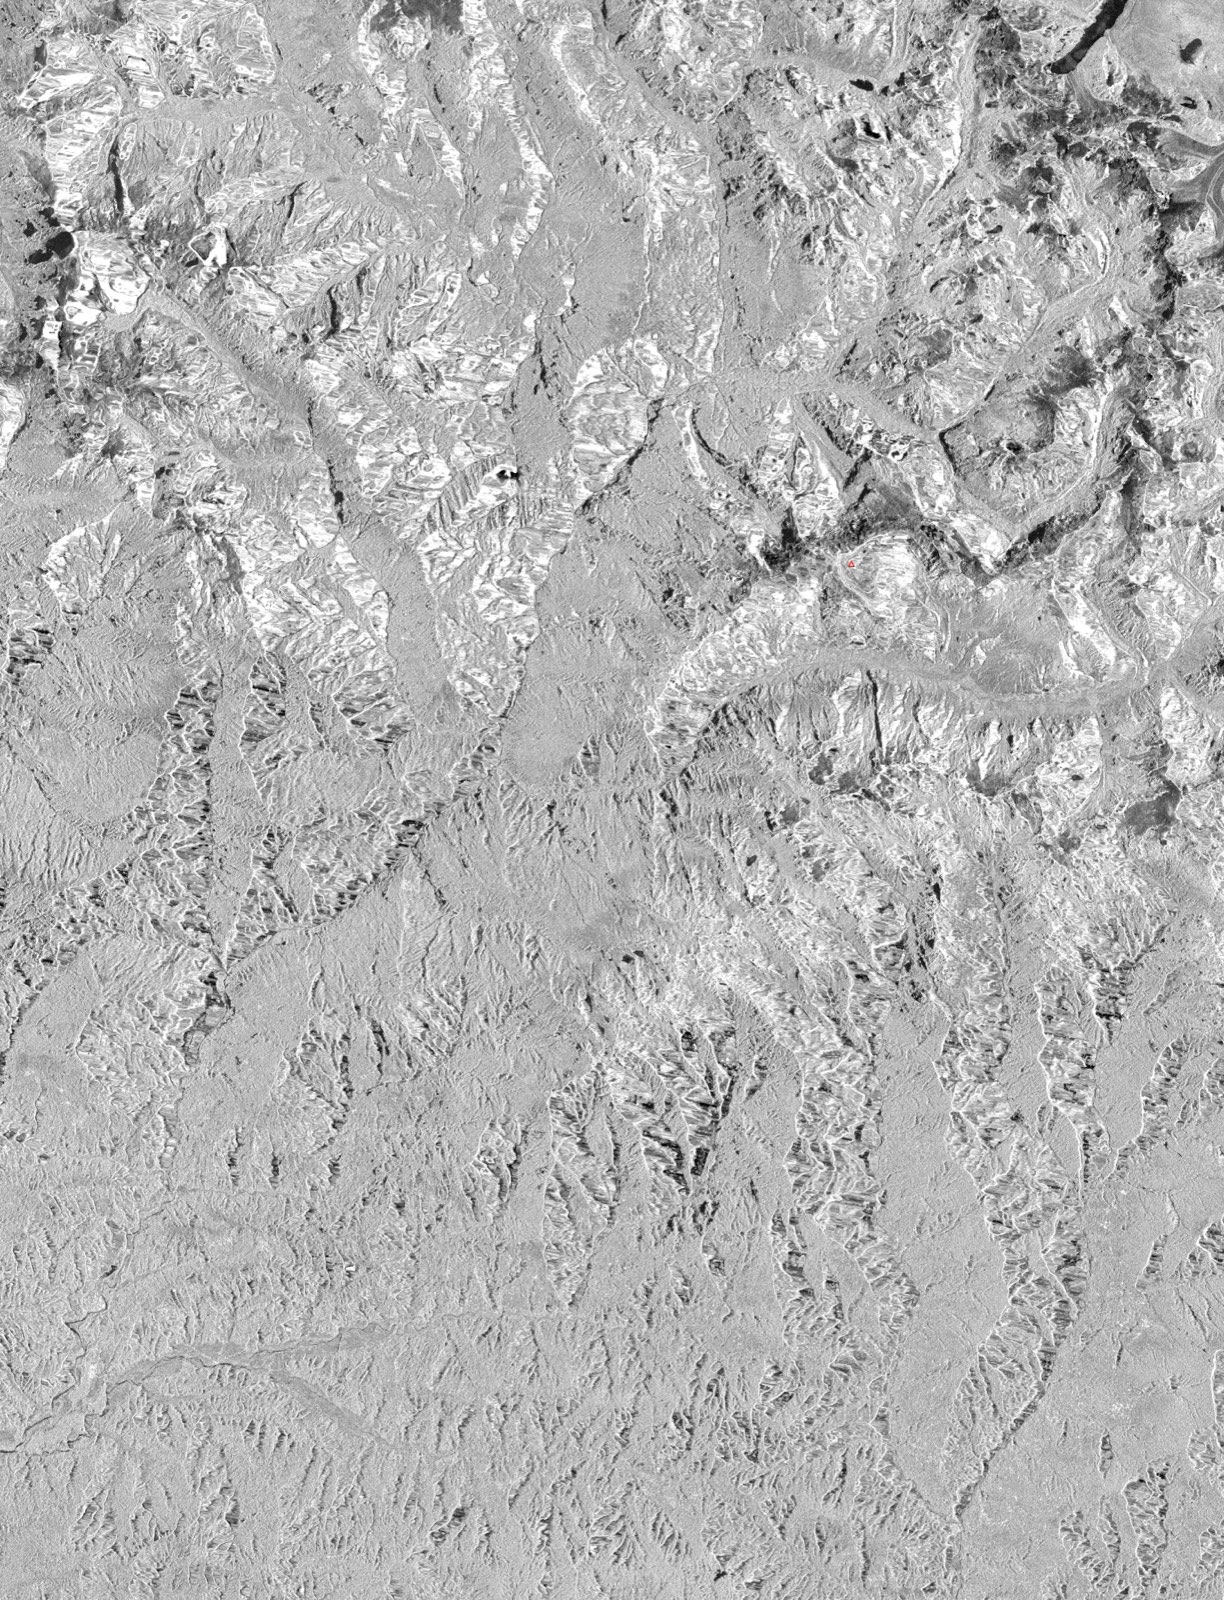 Pre-event 08-24 descending VV
Post-event 09-05 descending VV
Pre-event 08-24 descending VV
Post-event 09-05 descending VV
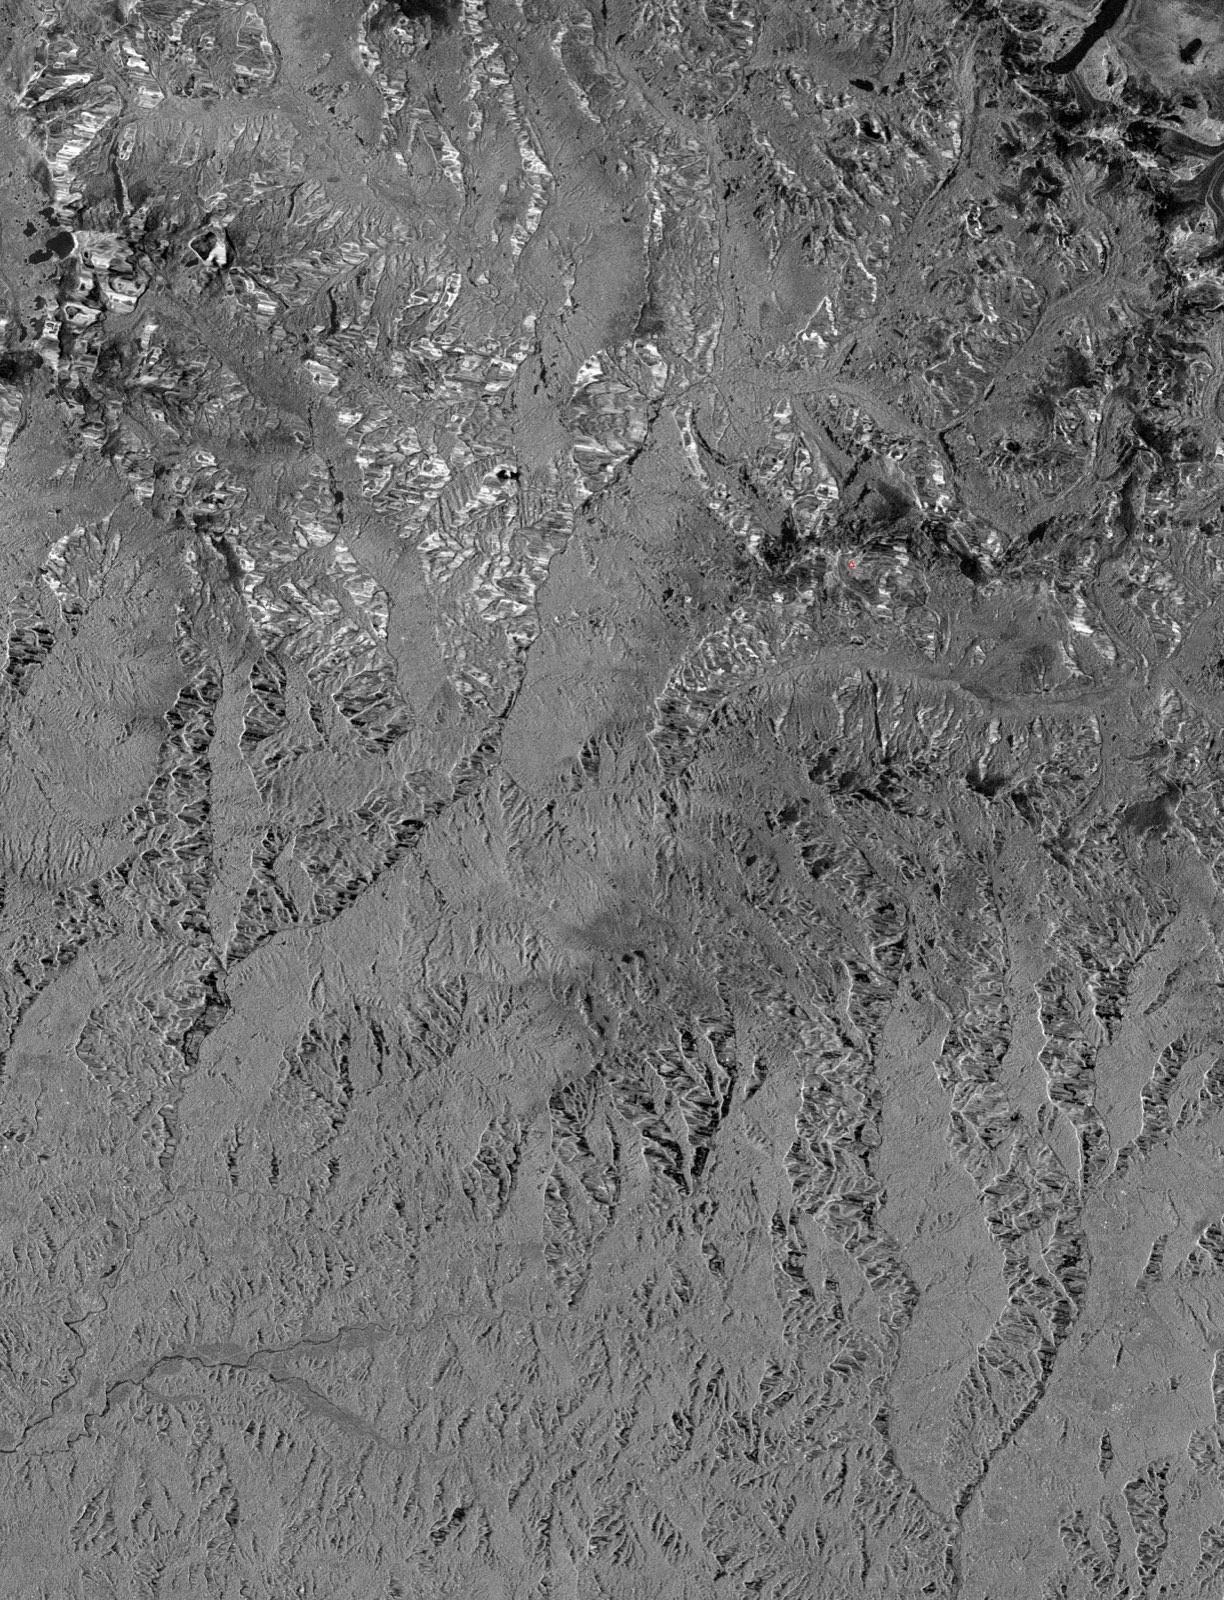 Pre-event 08-24 descending VH
Post-event 09-05 descending VH
Pre-event 08-24 descending VH
Post-event 09-05 descending VH
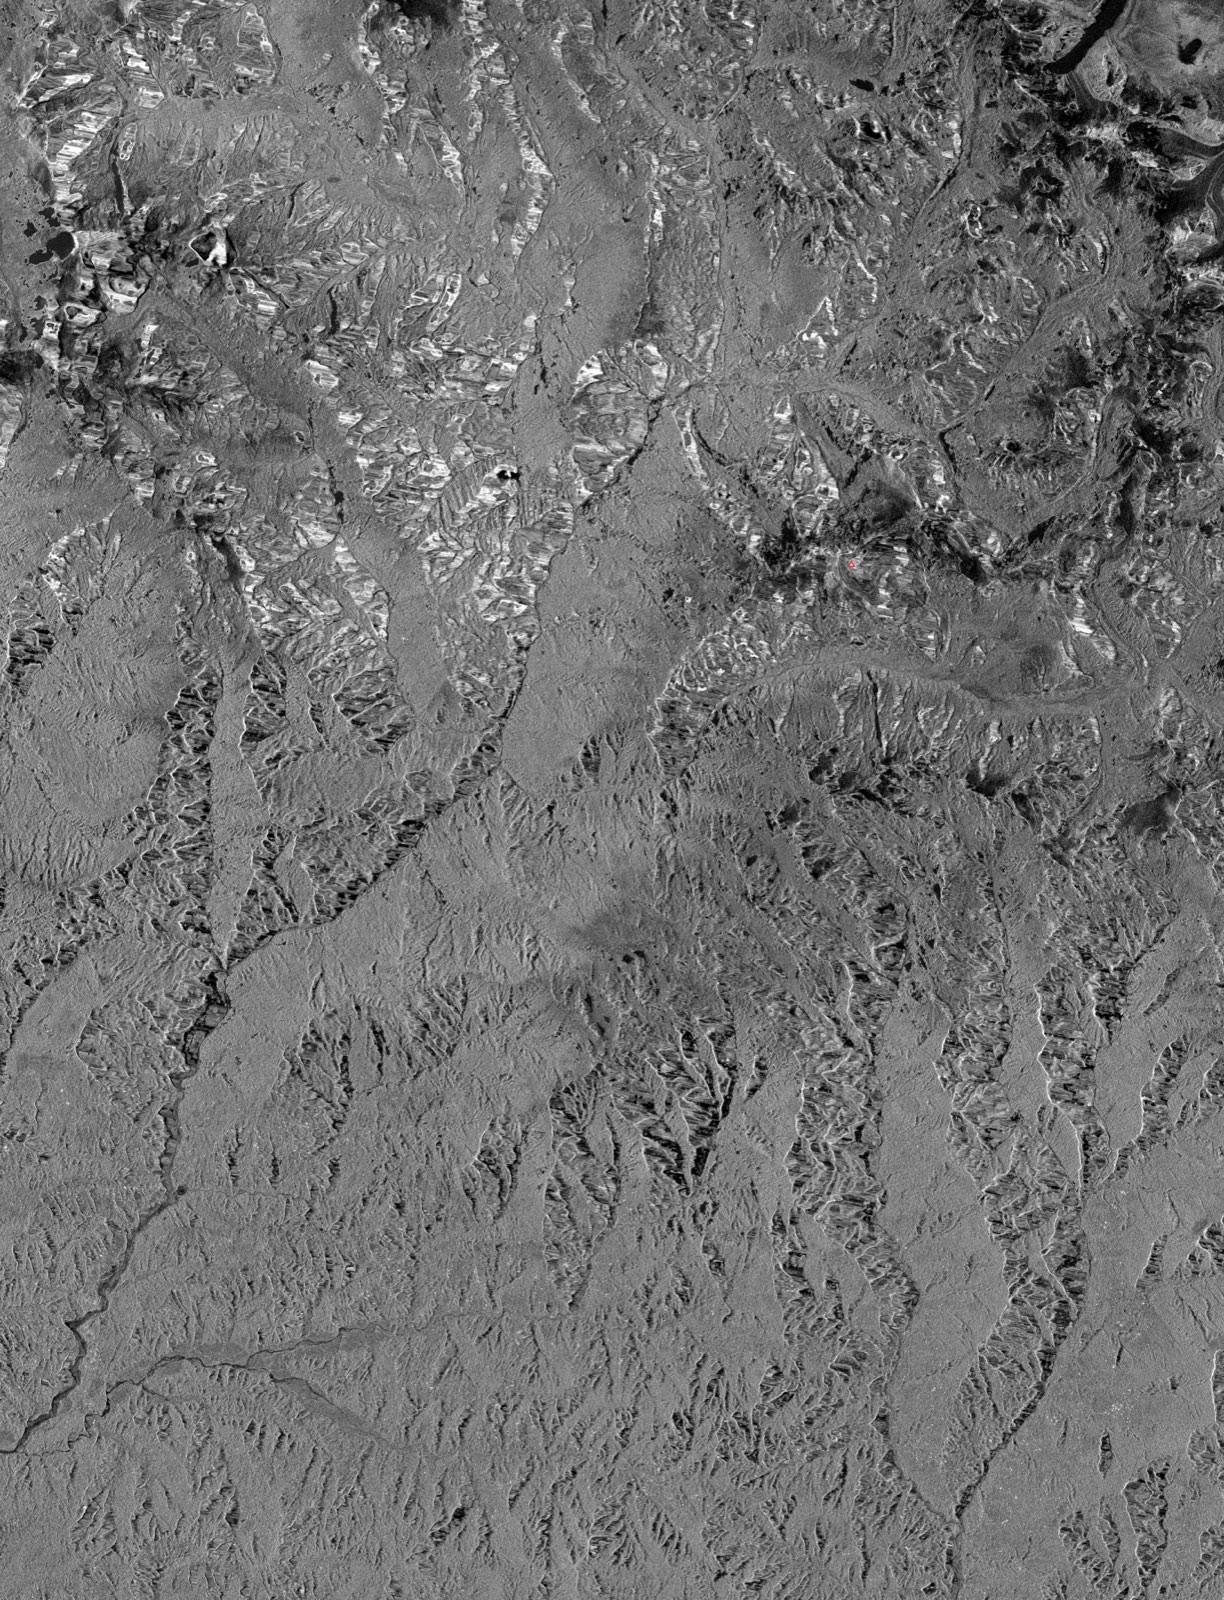
Change areas are VV darkening 37.39 / brightening 39.87 km² across 398 polygons, and VH darkening 29.61 / brightening 23.34 km² across 247 polygons. The noise floor measured by the same procedure on the pre-event same-track pairs is VV 22 and VH 29 km².
Box densities, with the denominator aligned to the common footprint with the path 85 cross-event pair: source box VV 3.61× and VH 2.19×, corridor box VV 0.79× and VH 0.65×, tibet_snow_ctl box VV 3.02× and VH 2.78×.
Valley-floor stratification of VH darkening (below −3 dB), for the 08-24 to 09-05 event pair and the 08-12 to 08-24 pre-event control pair, which spans the same 12-day baseline:
| Reach | Event pair, floor% / slope% | Event ratio | Control, floor% / slope% | Control ratio |
|---|---|---|---|---|
| downstream window | 9.07 / 0.57 | 16.03× | 0.33 / 0.14 | 2.42× |
| reach_upper | 14.20 / 0.80 | 17.74× | 0.65 / 0.10 | 6.81× |
| offriver_control | 0.32 / 0.30 | 1.08× | 0.03 / 0.11 | 0.25× |
| gorge window | 1.47 / 0.39 | 3.76× | 0.18 / 0.30 | 0.60× |
| port_reach | 3.18 / 0.61 | 5.19× | 1.00 / 0.22 | 4.53× |
| timure_syabru | 2.77 / 0.52 | 5.33× | 0.05 / 0.12 | 0.39× |
| below_syabru | 4.48 / 0.51 | 8.75× | 0.00 / 0.15 | 0.00× |
The valley-floor area of port_reach is 0.2 km²; that row rests on 19 valley-floor pixels for the event pair and 6 for the control. The timure_syabru control row rests on 1 pixel, the below_syabru control row on 0.
Cross-track agreement against the path 85 cross-event pair as reference, darkening class: corridor box 8.69×, source box 6.09×, tibet_snow_ctl box 3.26×.
Sentinel-1 post-to-post pair (path 85, 08-28 to 09-09)
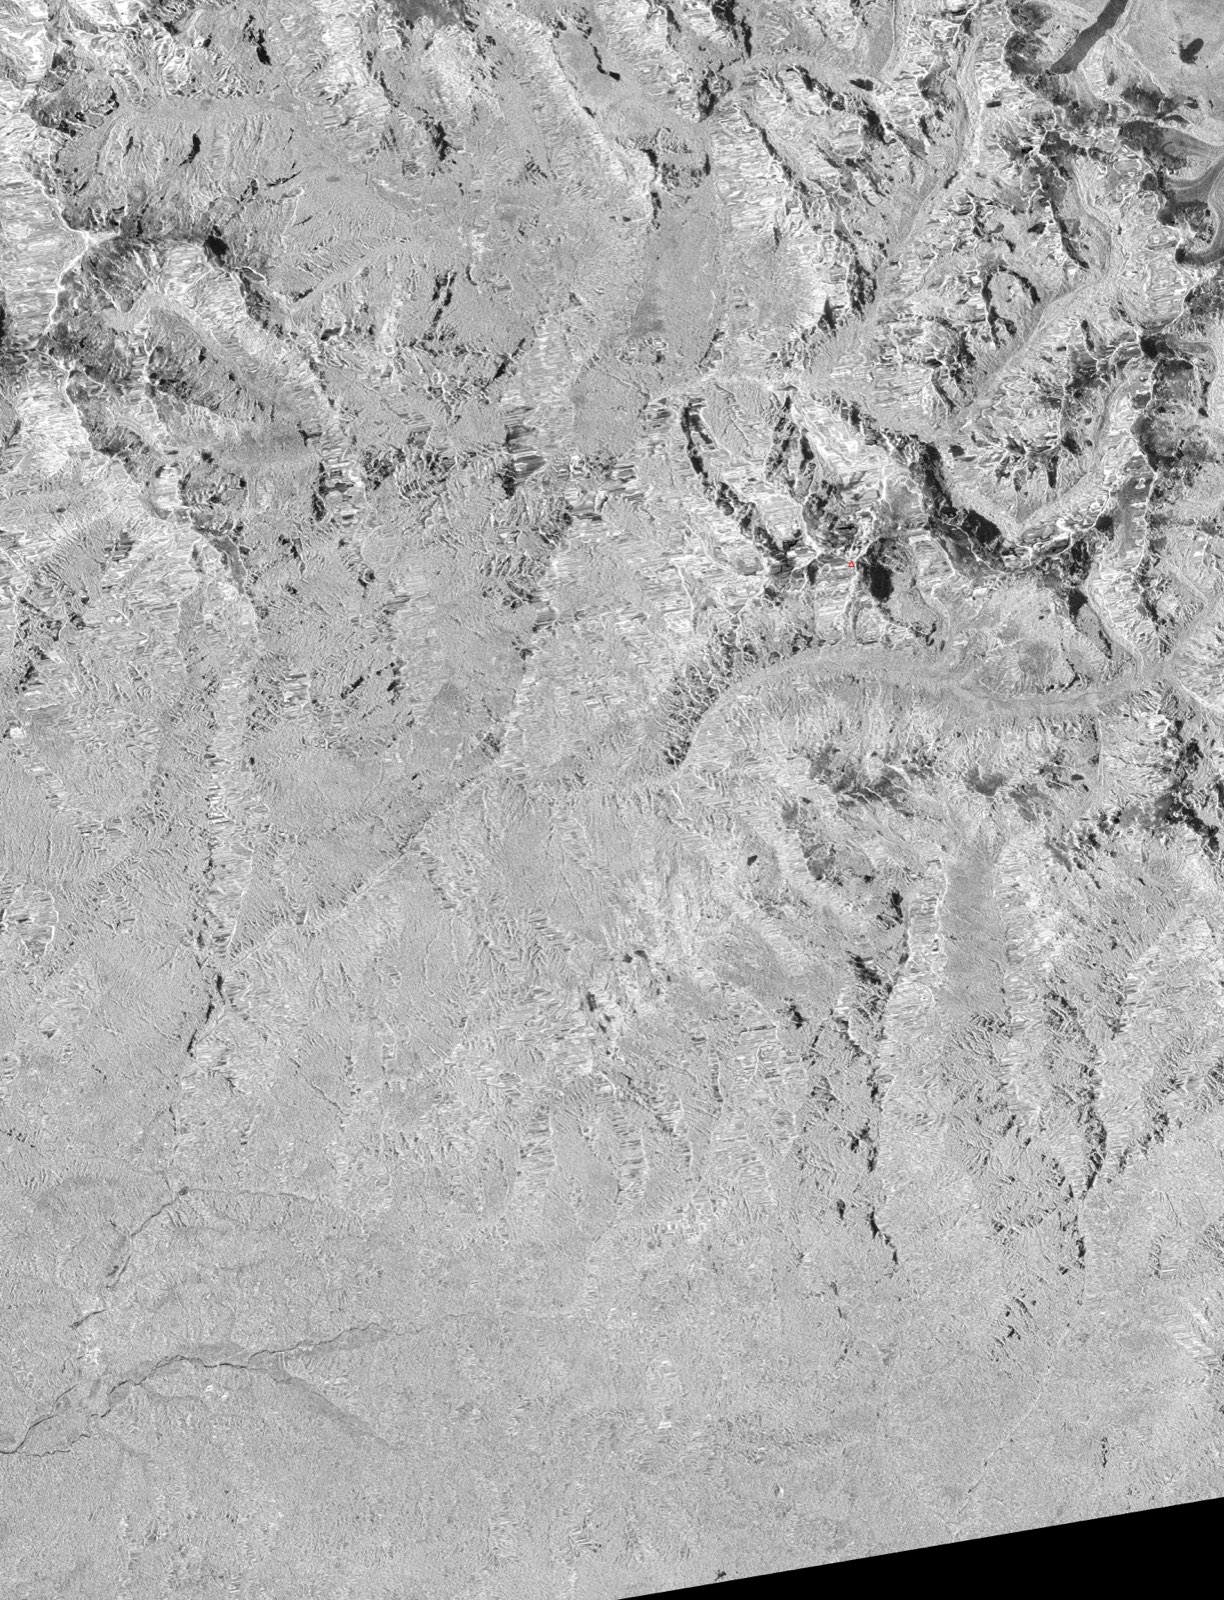
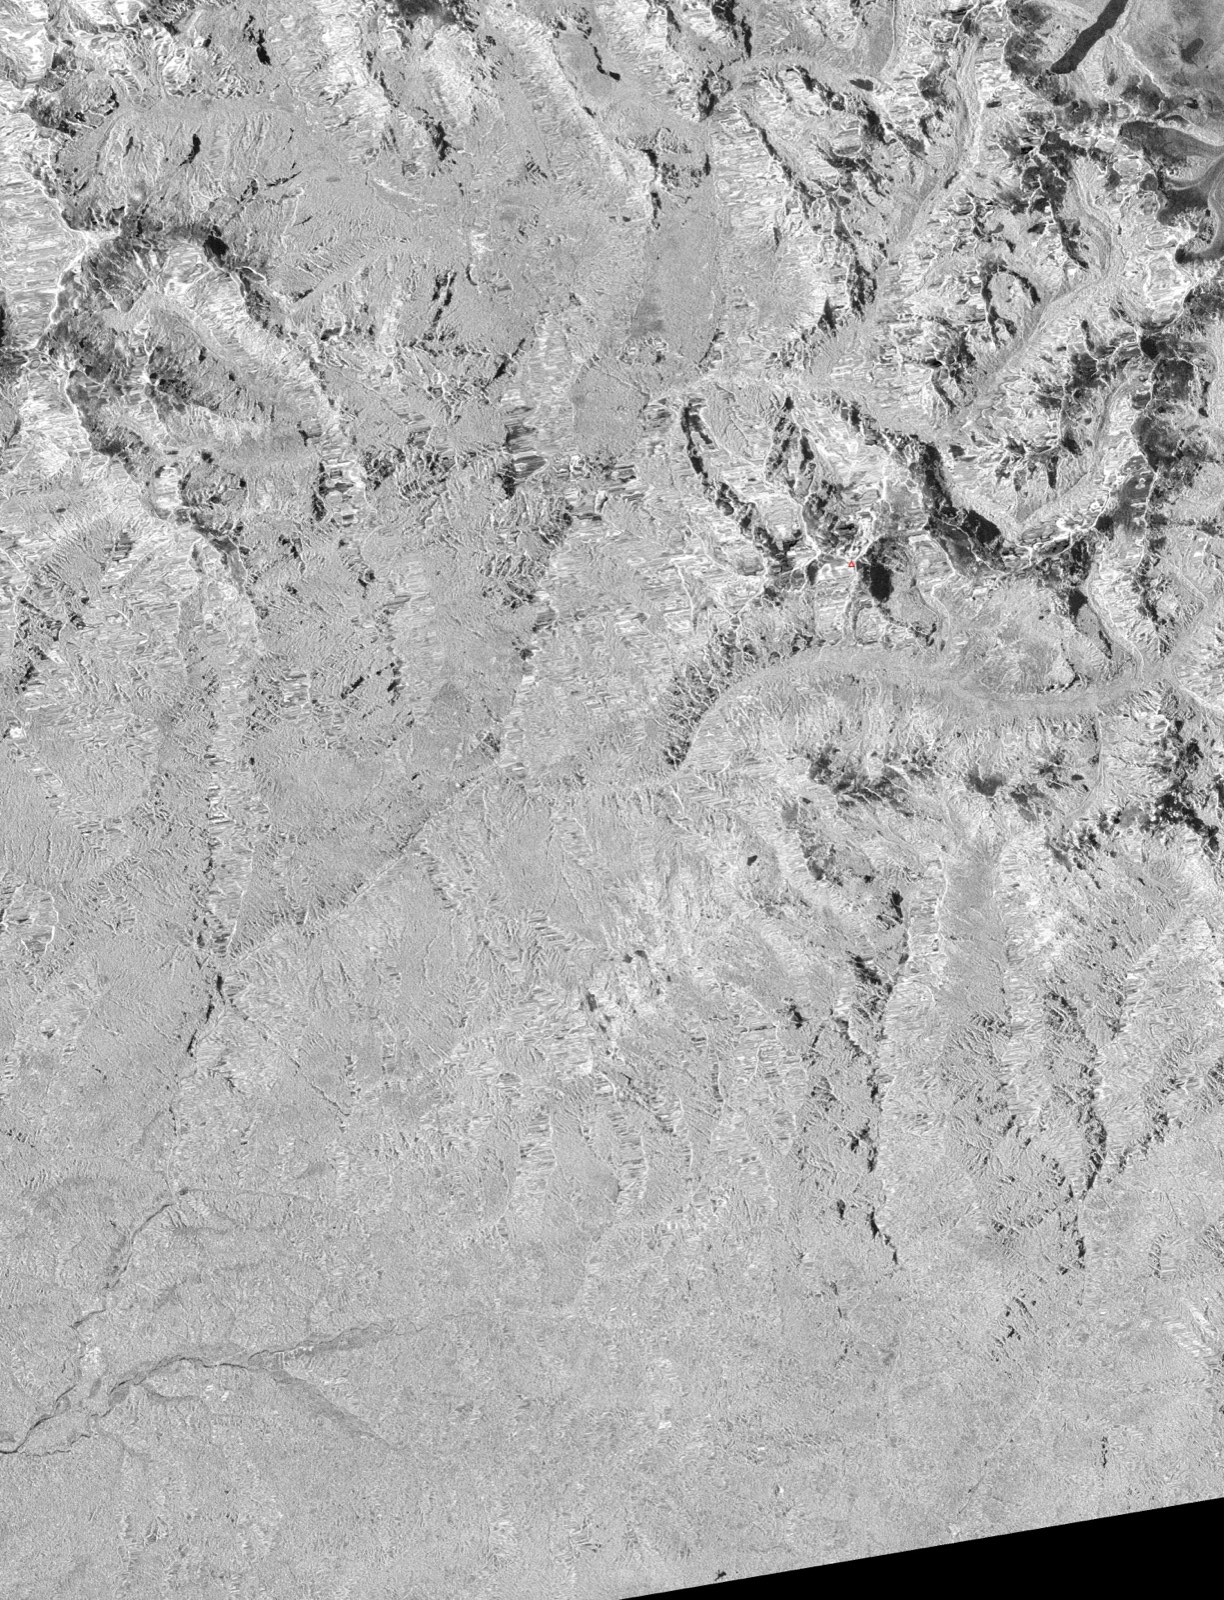
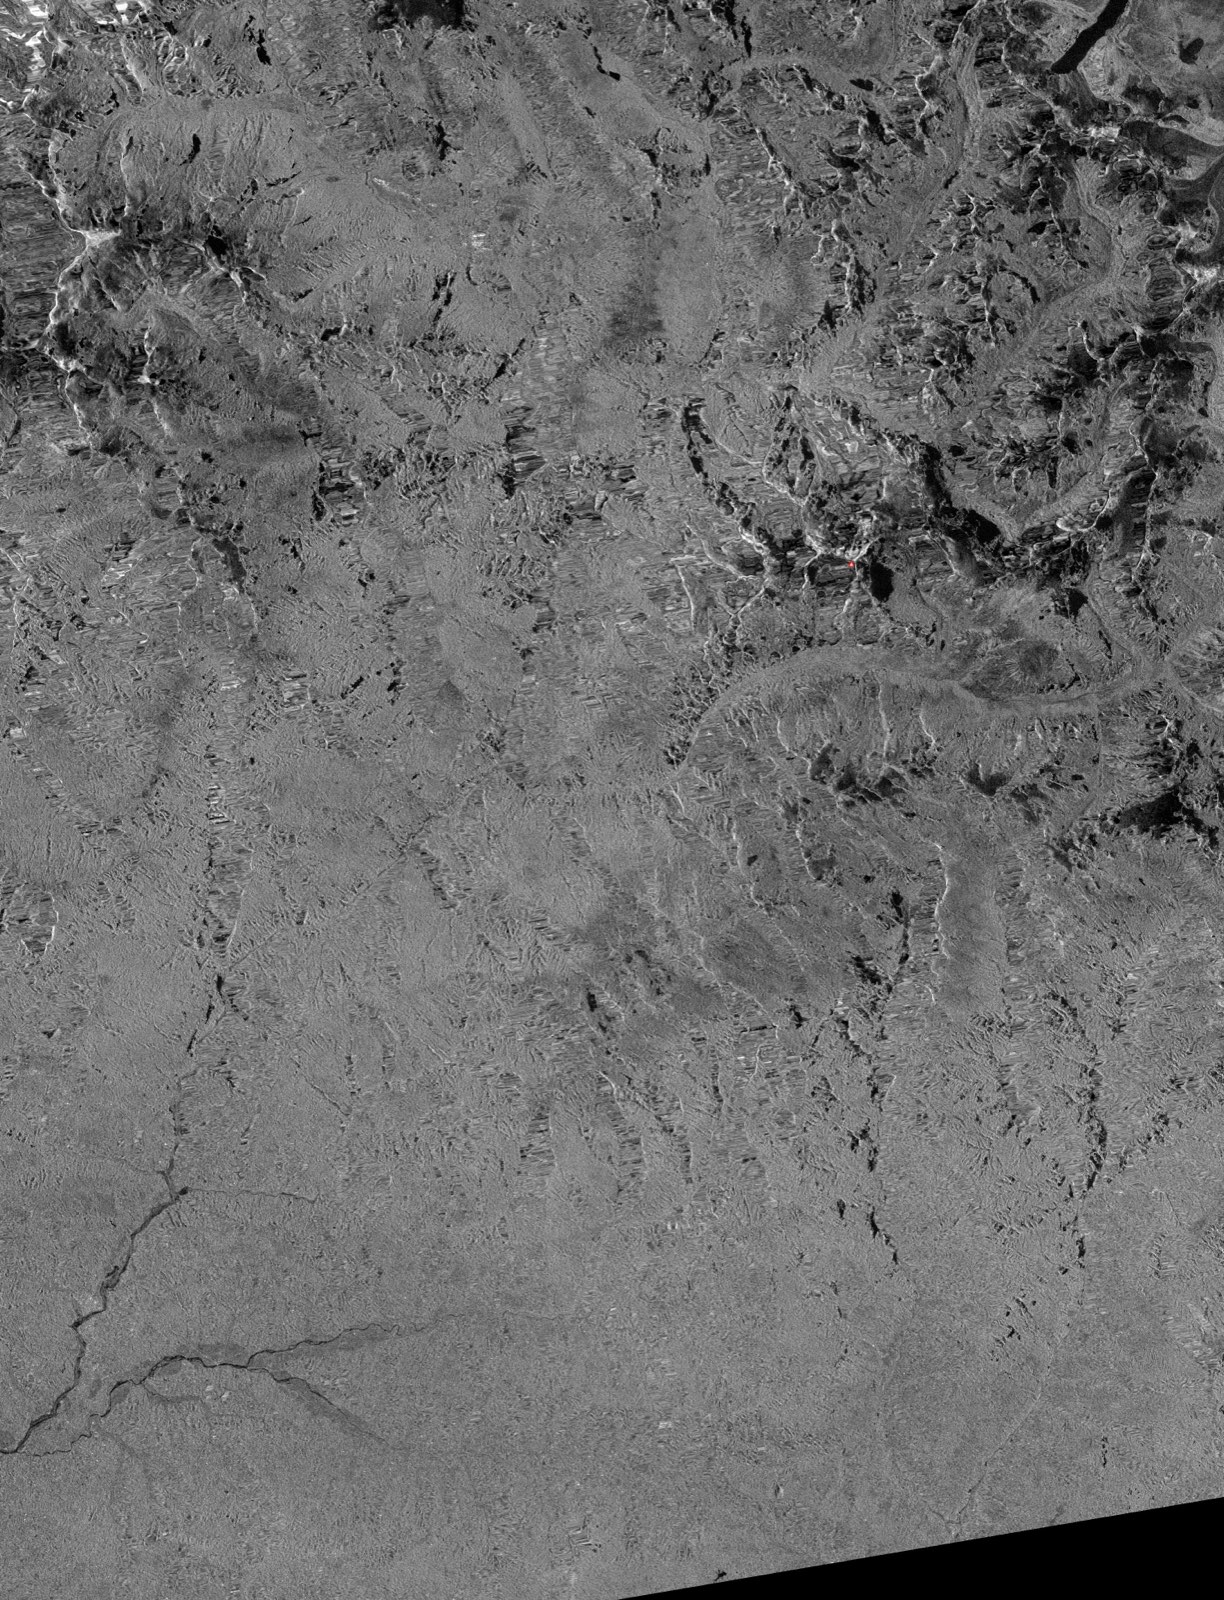
Path 85 ascending passed again at 09-09 12:21 UTC and the RTC product was ingested on 09-10. Both 08-28 and 09-09 fall after the event, so the two form a 12-day post-to-post pair.
 08-28 ascending VV
09-09 ascending VV
08-28 ascending VV
09-09 ascending VV
 08-28 ascending VH
09-09 ascending VH
08-28 ascending VH
09-09 ascending VH
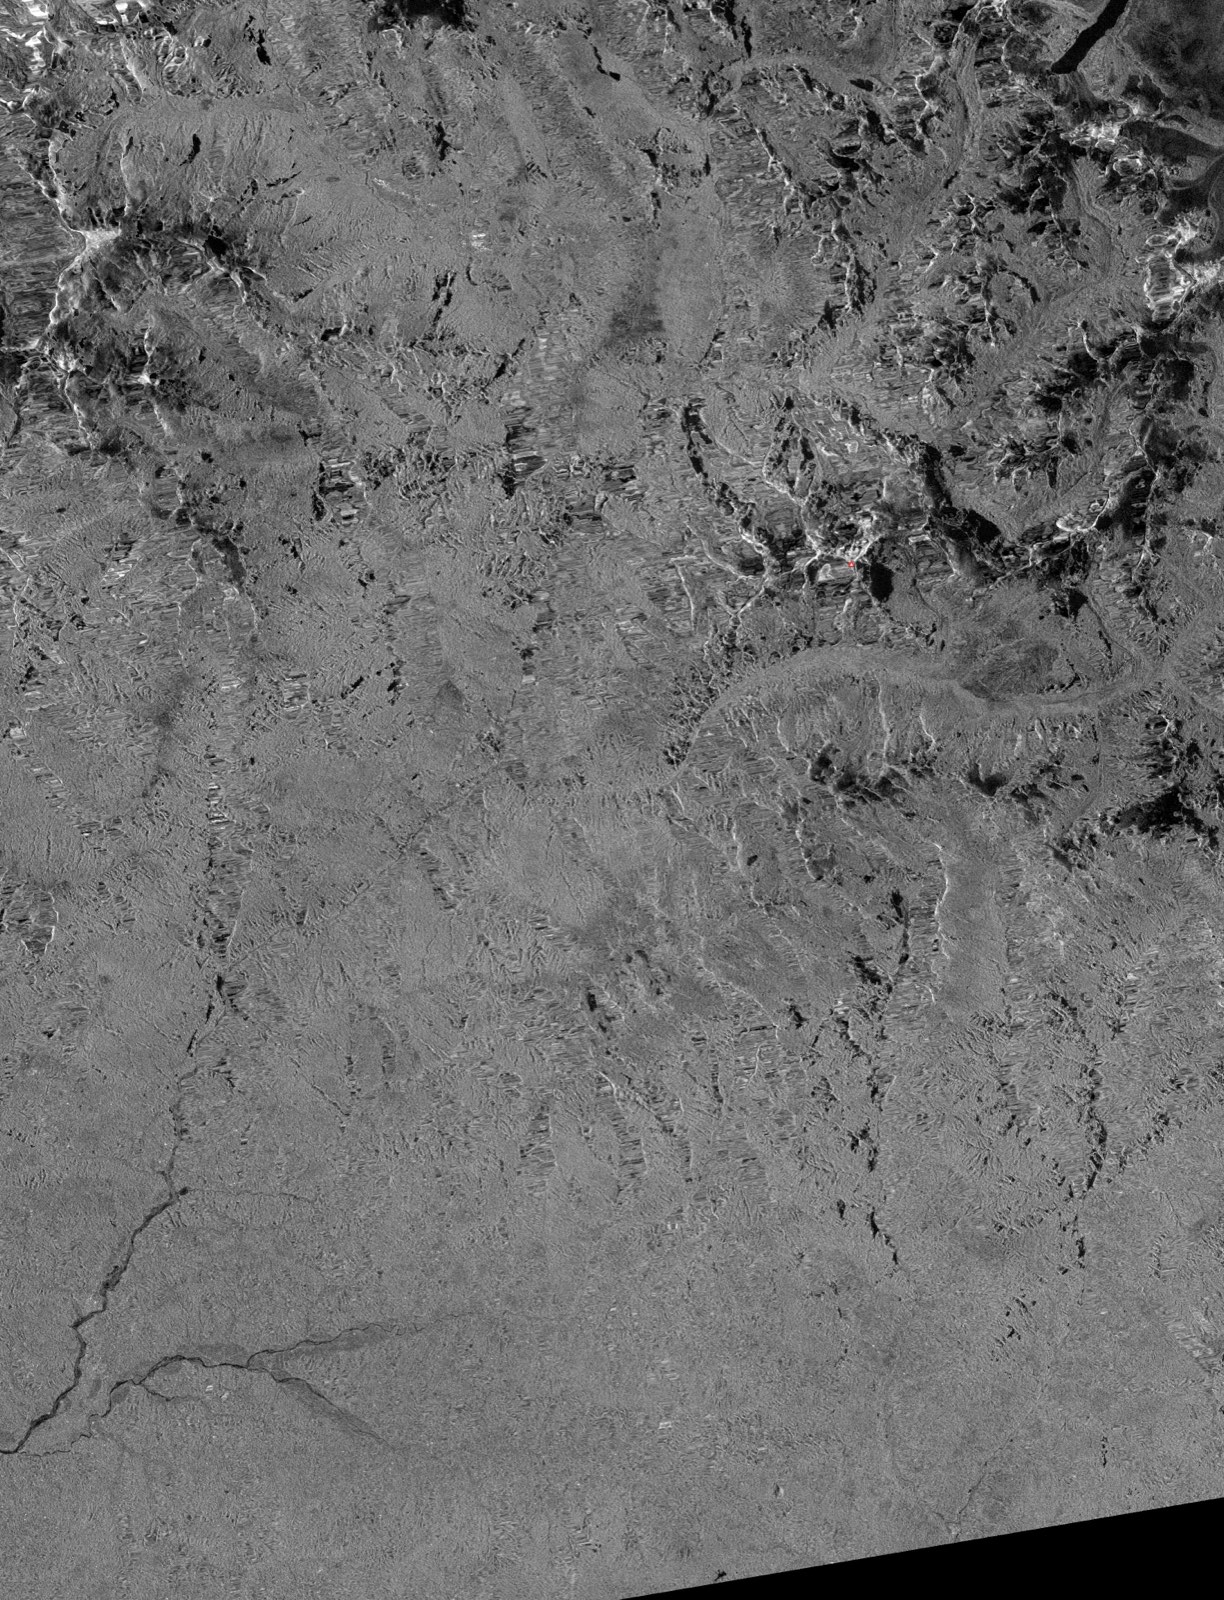
Change areas are VV darkening 57.66 / brightening 31.40 km² across 600 polygons, and VH darkening 41.55 / brightening 37.94 km² across 439 polygons.
Valley-floor stratification of VH darkening (below −3 dB) in the reach_upper box: the 08-16 to 08-28 cross-event pair gives 10.20% on the floor against 0.19% on the slopes, a ratio of 53.20×; the 08-28 to 09-09 post-to-post pair gives 0.83% against 0.16%, a ratio of 5.11×. The same post-to-post pair gives 0.08% against 0.06% in the offriver_control box, a ratio of 1.35×.
A log-ratio measures change between its two dates. Channel bed that had already darkened before 08-28 and did not change afterwards produces no darkened pixels in this pair. What these numbers give is the decrease in the rate of change within the channel over the 12 days following the event.
NISAR path 98 ascending (L-band)
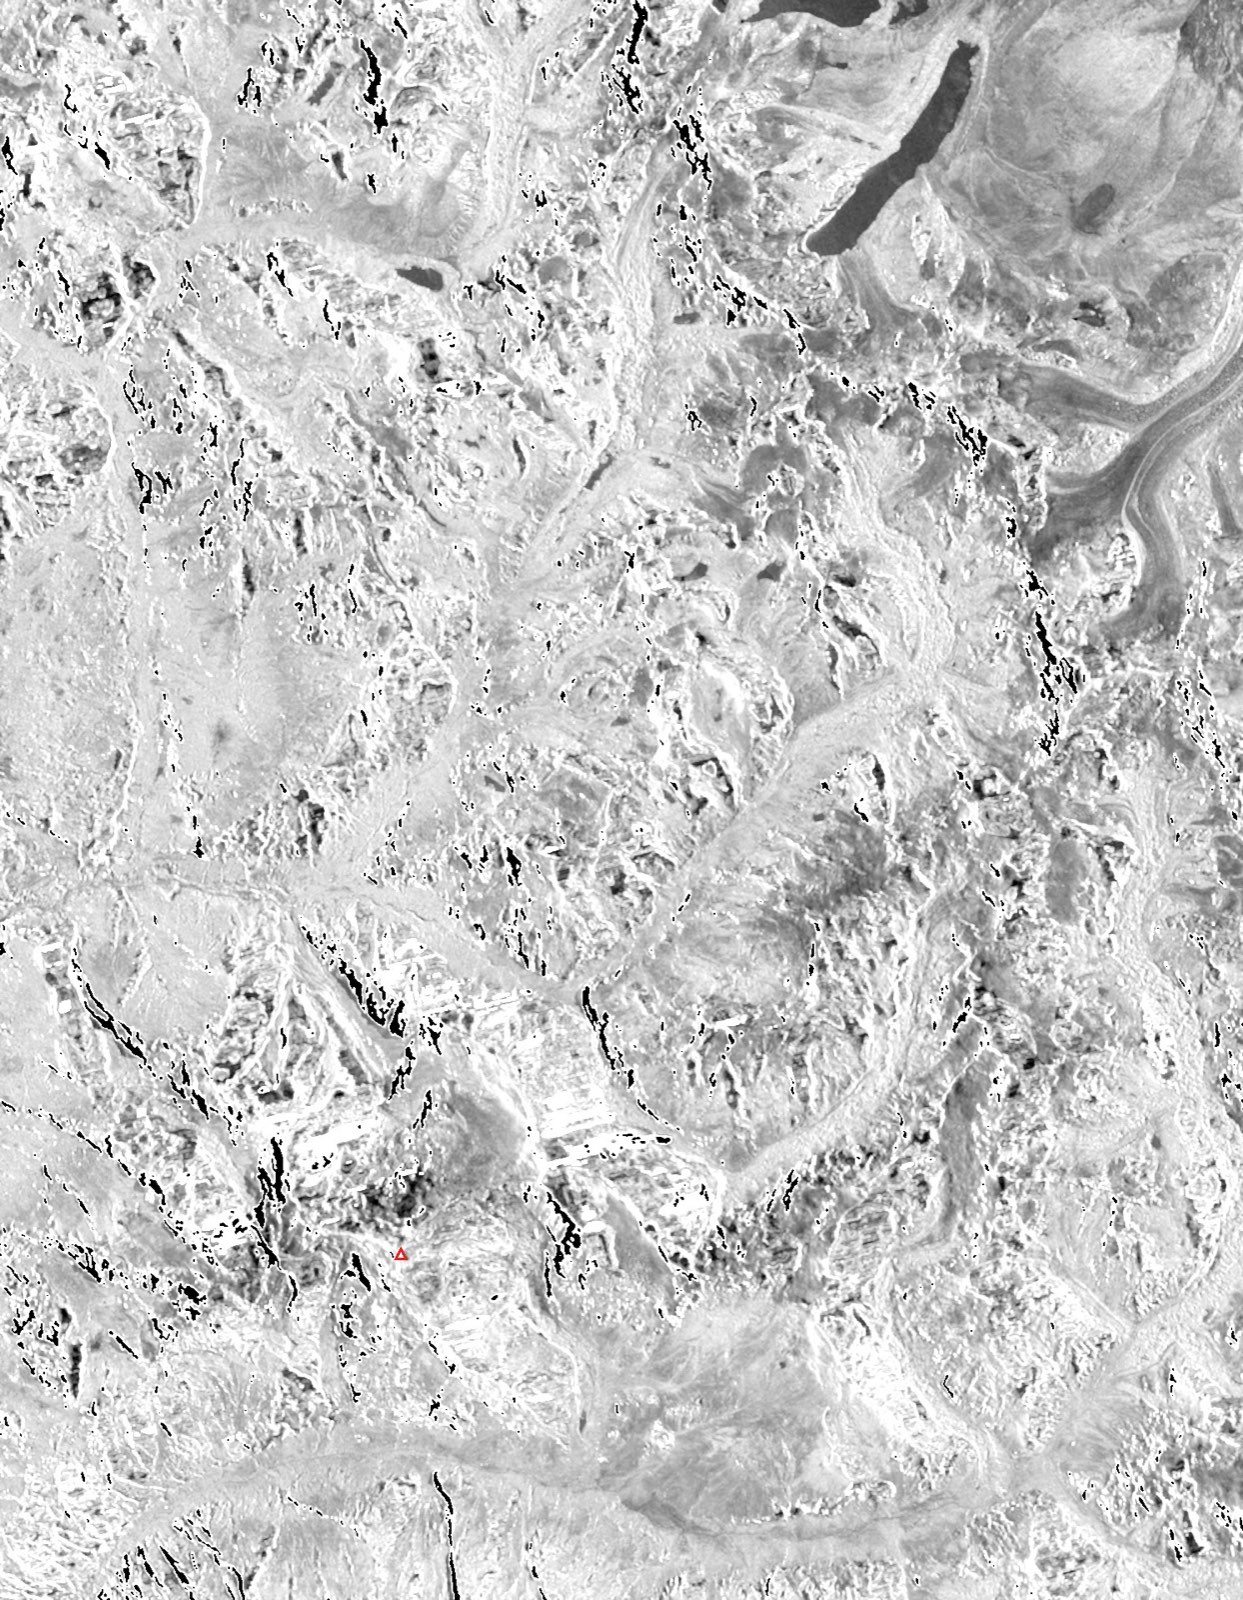
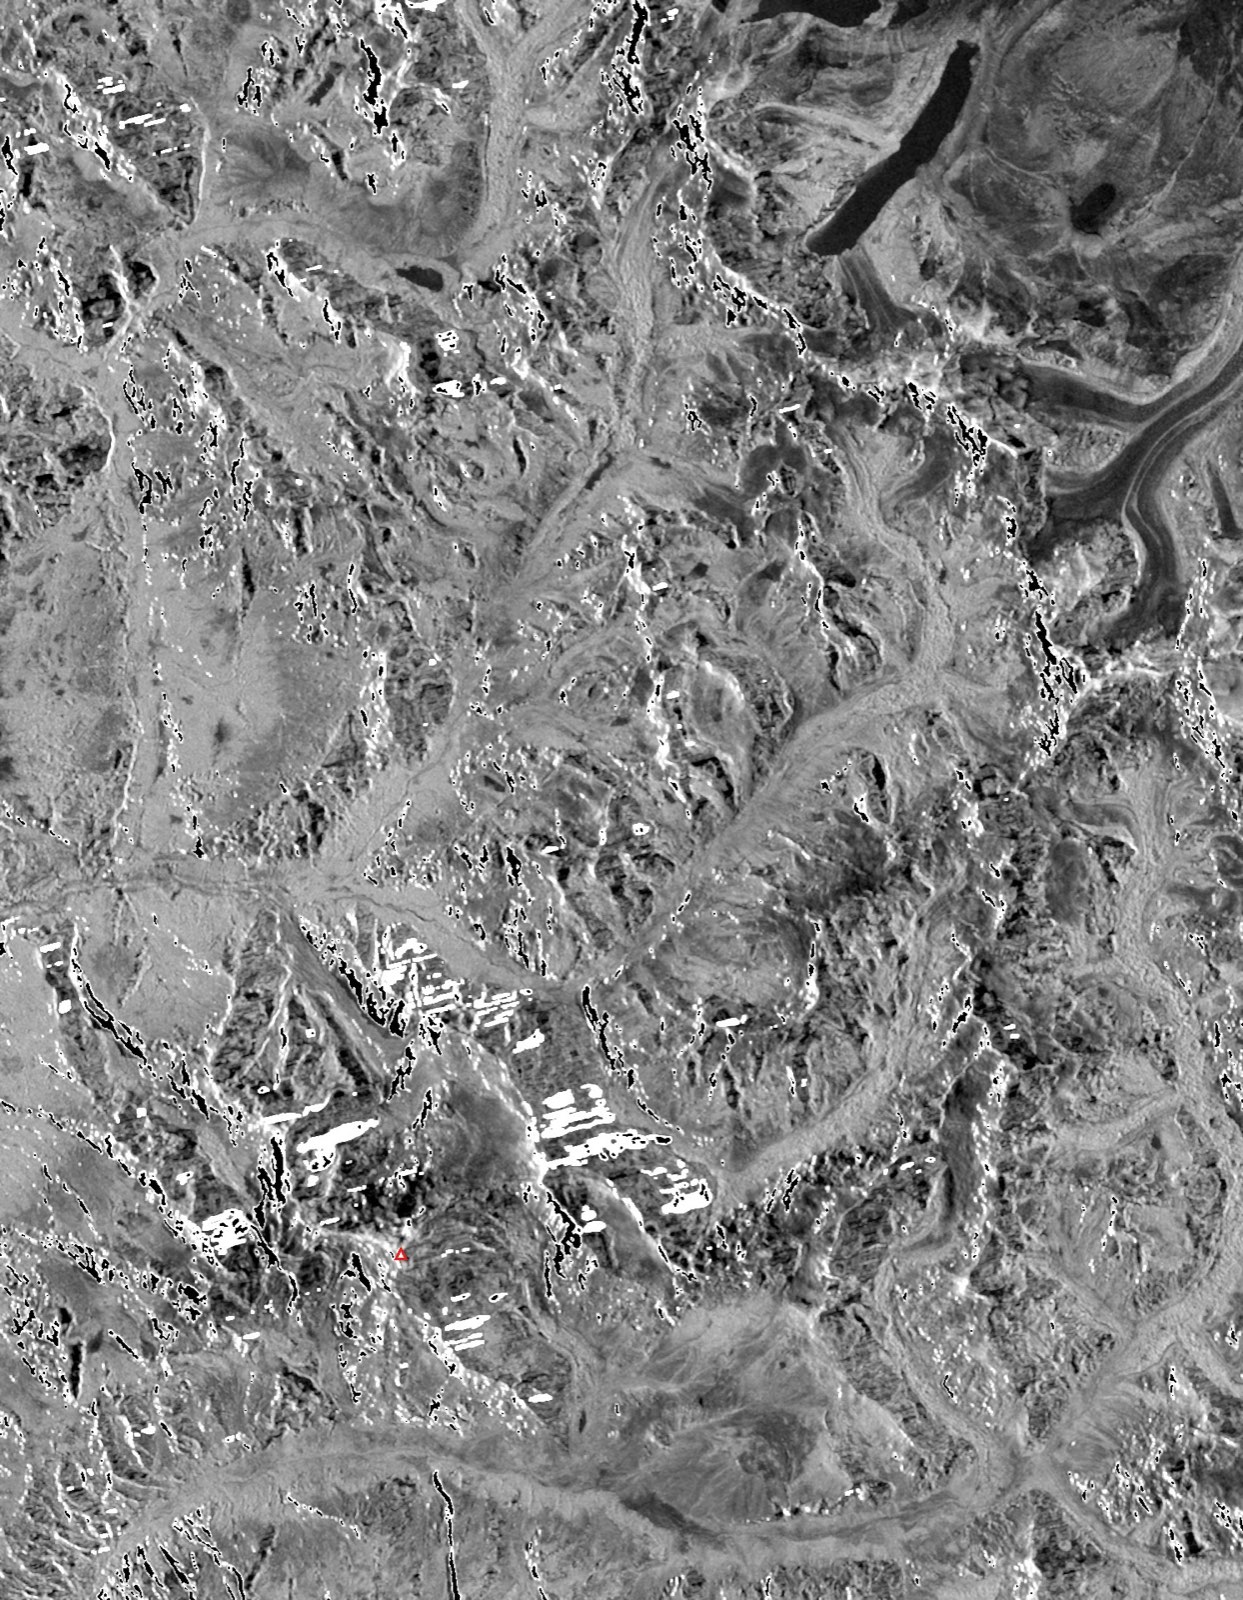
NISAR path 98 ascending passed at 08-31 23:39 UTC and forms a 12-day pair with the 08-19 pre-event scene, the second L-band viewing geometry over the source zone.
The two ends of the path 48 pair in the previous section come from different processing streams at different postings, and the peak-to-peak range-direction profile removed during detrending there is 18.48 dB in HH and 20.79 dB in HV. The two ends of the path 98 pair come from one processing stream at one posting, and the same quantity is 0.76 dB in HH and 0.83 dB in HV. For the pre-event control pairs, whose two ends share a processing stream, it is 0.67 dB HH and 0.70 dB HV on path 48, and 2.05 dB HH and 1.58 dB HV on path 98. The amplitude channel is used in this section.
The coherence products in this section, for the event pair and for every reference pair, are in the routine stream, so the differencing happens within one stream.
The path 98 pair carries the same 4000_SH mode in both streams and the same input scenes. Running the same event pair through the urgent-response stream gives valley-floor stratification ratios over the gorge window of 5.52× for the whole window, 4.85× for port_reach, 12.82× for timure_syabru and 20.02× for below_syabru, against 7.34×, 5.74×, 18.83× and 22.54× from the routine stream in the table below; the difference comes from the processing stream. Both streams produce provisional products, and nothing here establishes which is closer to truth.
Three clip windows are used: source window 85.42–85.72°E, 28.18–28.53°N; gorge window 85.25–85.60°E, 28.03–28.35°N; downstream window 85.02–85.35°E, 27.80–28.06°N. The downstream window is about 30 km from the peak and does not contain it.
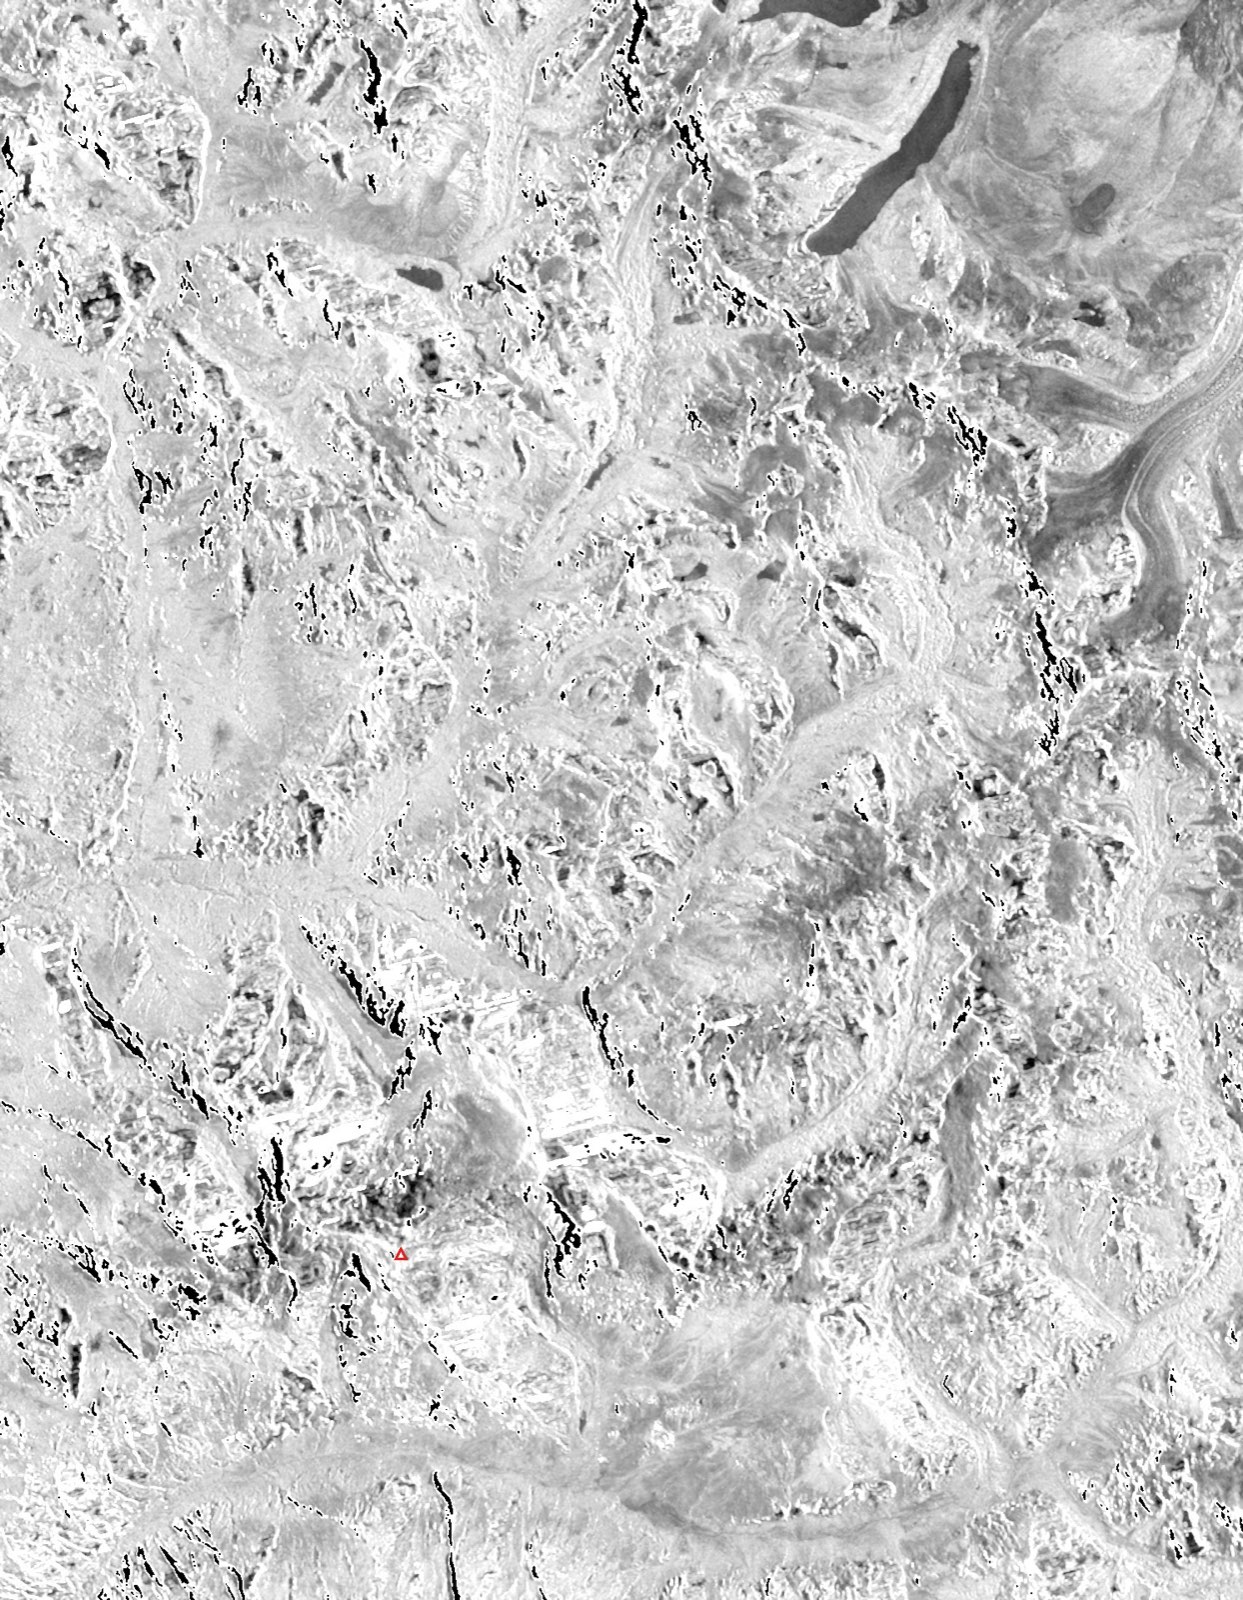 Pre-event 08-19 HH
Post-event 08-31 HH
Pre-event 08-19 HH
Post-event 08-31 HH
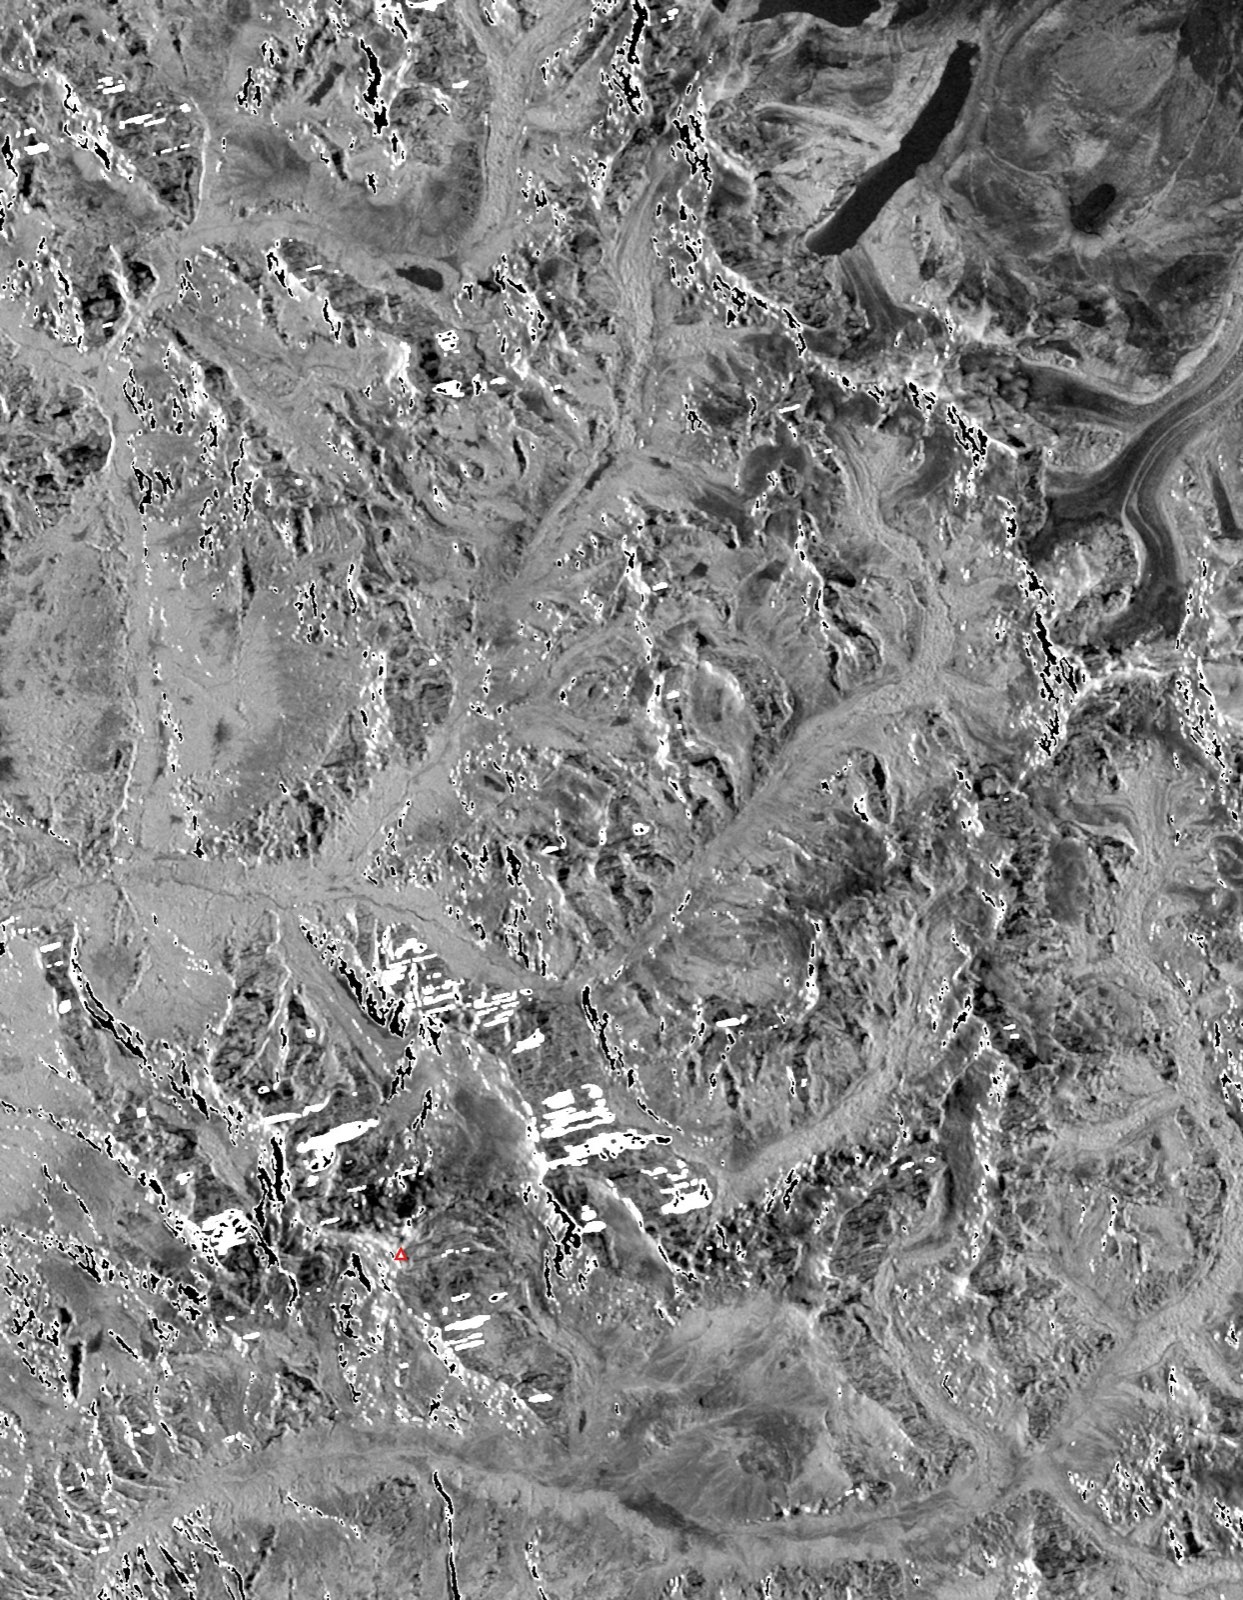 Pre-event 08-19 HV
Post-event 08-31 HV
Pre-event 08-19 HV
Post-event 08-31 HV
 Pre-event 08-19 HH
Post-event 08-31 HH
Pre-event 08-19 HH
Post-event 08-31 HH
 Pre-event 08-19 HV
Post-event 08-31 HV
Pre-event 08-19 HV
Post-event 08-31 HV
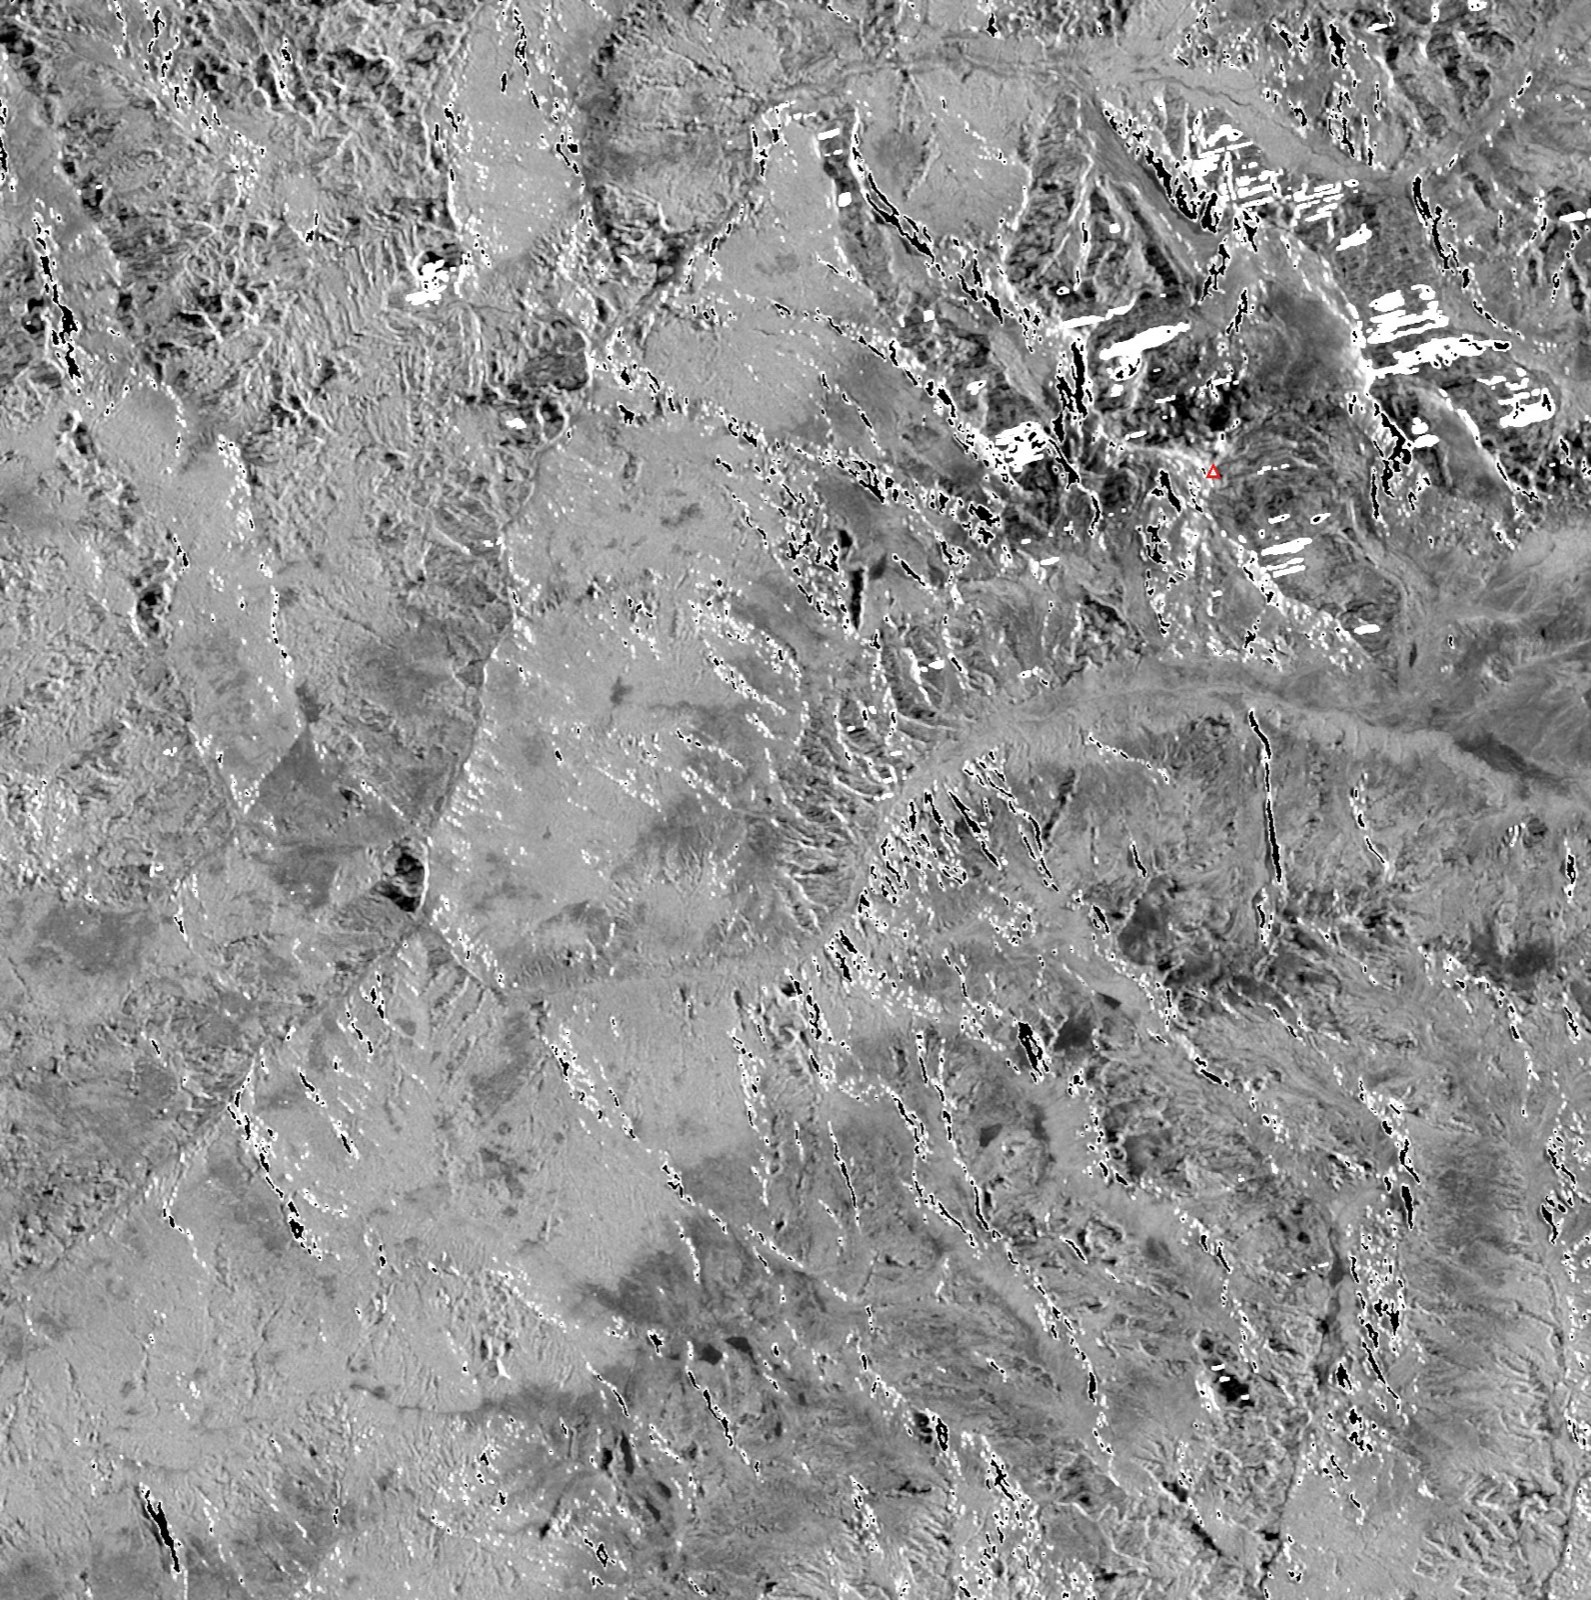
Amplitude box density in the source box (absolute log-ratio above 3 dB, HH / HV): 6.20% / 5.79% for the event pair, 3.93% / 3.55% for the 07-14 to 07-26 pre-event control pair. Fraction of pixels losing more than 0.2 in coherence: source box 12% for the event pair against 4% for the pre-event control; tibet_snow_ctl box 5% against 1%; whole window 5% against 2%. The pre-event coherence median in the source box is 0.44.
Cross-geometry agreement with path 48 descending (coherence rasters on both sides, threshold 0.2, darkening class): 2.44× testing path 98 against path 48 as reference, 2.10× testing path 48 against path 98; the tibet_snow_ctl box gives 0.76× and 0.80×. The denominator here is the change rate at pixels the reference did not flag inside the same box.
Valley-floor stratification over the gorge window (floor% / slope% = ratio):
| Measure | Whole window | port_reach | timure_syabru | below_syabru |
|---|---|---|---|---|
| Coherence loss above 0.2, event pair | 31.82 / 4.34 = 7.34× | 63.46 / 11.05 = 5.74× | 64.02 / 3.40 = 18.83× | 70.79 / 3.14 = 22.54× |
| Coherence loss above 0.2, control | 7.49 / 6.35 = 1.18× | 1.92 / 1.40 = 1.38× | 16.93 / 15.13 = 1.12× | 14.61 / 18.40 = 0.79× |
| HH darkening below −3 dB, event pair | 2.60 / 0.94 = 2.76× | 2.28 / 1.73 = 1.32× | 6.80 / 0.46 = 14.83× | 8.23 / 0.41 = 19.91× |
| HH darkening below −3 dB, control | 0.19 / 0.90 = 0.21× | 0.70 / 0.85 = 0.82× | 0.05 / 0.29 = 0.16× | 0.00 / 0.36 = 0.00× |
| HV darkening below −3 dB, event pair | 3.58 / 1.10 = 3.26× | 6.33 / 1.87 = 3.38× | 9.73 / 0.58 = 16.75× | 7.72 / 0.48 = 16.01× |
The three kinds of row are constructed differently. The coherence-loss event rows use 07-14 to 07-26 (12 days) as the reference pair. The coherence-loss control row is the coherence of 07-02 to 07-14 minus that of 06-20 to 07-02, both 12-day pairs, neither spanning the event. The amplitude control rows are the log-ratio of the 07-14 to 07-26 pair itself.
Valley-floor stratification over the downstream window:
| Measure | Whole window | reach_upper | offriver_control |
|---|---|---|---|
| HH darkening below −3 dB, event pair | 10.32 / 0.16 = 65.05× | 12.50 / 0.18 = 68.72× | 0.90 / 0.07 = 12.98× |
| HH darkening below −3 dB, control | 1.96 / 0.23 = 8.58× | 2.74 / 0.34 = 8.03× | 0.69 / 0.16 = 4.33× |
| HV darkening below −3 dB, event pair | 7.89 / 0.15 = 52.98× | 11.51 / 0.16 = 72.47× | 0.33 / 0.09 = 3.87× |
| Coherence loss above 0.2, event pair | 11.44 / 0.59 = 19.32× | 14.81 / 0.65 = 22.77× | 0.96 / 0.81 = 1.19× |
The coherence-loss row over the downstream window uses 07-26 to 08-19 as its reference pair, a 24-day baseline and the closest pre-event interferometric pair by season in the archive. The two amplitude rows are constructed as in the gorge window.
NISAR path 149 descending (L-band)
NISAR path 149 descending frame 074 passed at 09-04 13:06 UTC and forms a 12-day pair with the 08-23 pre-event scene, the third L-band viewing geometry. It covers the reach_upper and reach_lower downstream boxes; it covers neither the peak nor the border crossing.
The two GCOV products at the ends of this pair are in different acquisition modes (2005_QPDH on 08-23, 4005_DHDH on 09-04), so the amplitude channel is not processed here, and the archive holds no same-mode pre-event control pair to go with it. This section has coherence results only, and no imagery. On the coherence side both the event pair and the 08-11 to 08-23 control pair are 2000_SH, both span 12 days, and the interferometric products of both come from the routine stream.
Valley-floor stratification of coherence loss (floor% / slope% = ratio):
| Measure | Whole window | reach_upper | reach_lower |
|---|---|---|---|
| Loss above 0.2, event pair | 13.81 / 2.65 = 5.22× | 20.41 / 0.96 = 21.26× | 14.44 / 3.52 = 4.10× |
| Loss above 0.2, control | 2.26 / 2.04 = 1.11× | 1.53 / 2.05 = 0.75× | 2.38 / 1.79 = 1.33× |
| Loss above 0.4, event pair | 3.66 / 0.08 = 43.68× | 5.72 / 0.04 = 129.89× | 3.39 / 0.13 = 26.06× |
| Loss above 0.4, control | 0.16 / 0.04 = 4.04× | 0.04 / 0.04 = 0.94× | 0.00 / 0.02 = 0.00× |
The two control rows for loss above 0.4 rest on very few valley-floor pixels: 1 in reach_upper and 0 in reach_lower.
Without valley-floor stratification, the event pair gives a median coherence change of +0.07 in reach_upper, with 3% of pixels losing more than 0.2 in coherence, against 2% for the pre-event control pair.
What the public optical imagery currently establishes
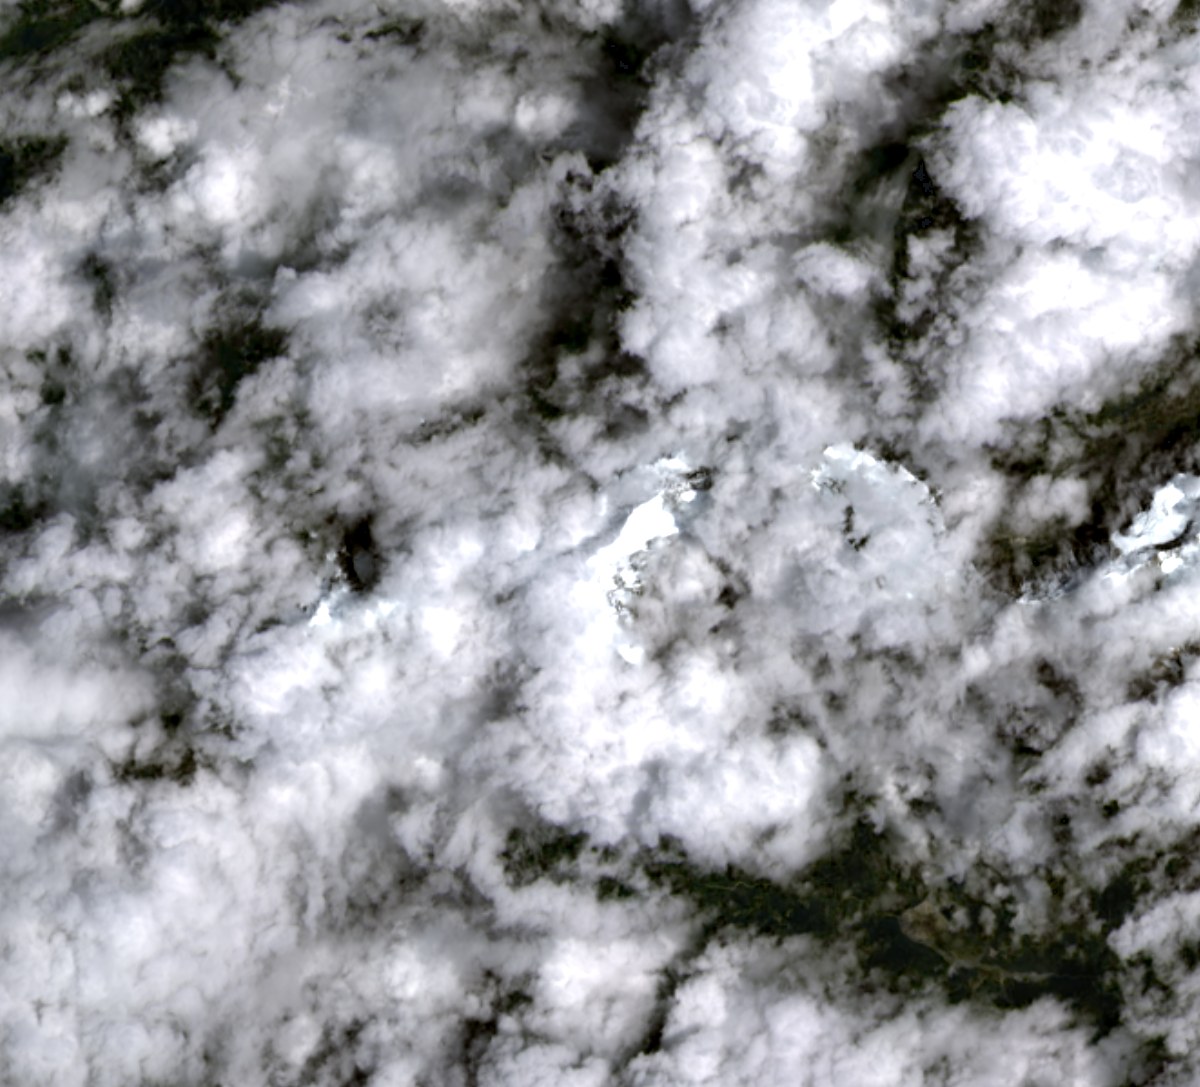
Landsat 9
Landsat 9 acquired the scene at 04:47:49 UTC on 2026-08-26, taken from the STAC metadata of LC09_L2SP_141040_20260826_02_T1, about 1 hour 56 minutes after the collapse.
 Pre-event 08-10
Post-event 08-26 04:47 UTC
Pre-event 08-10
Post-event 08-26 04:47 UTC
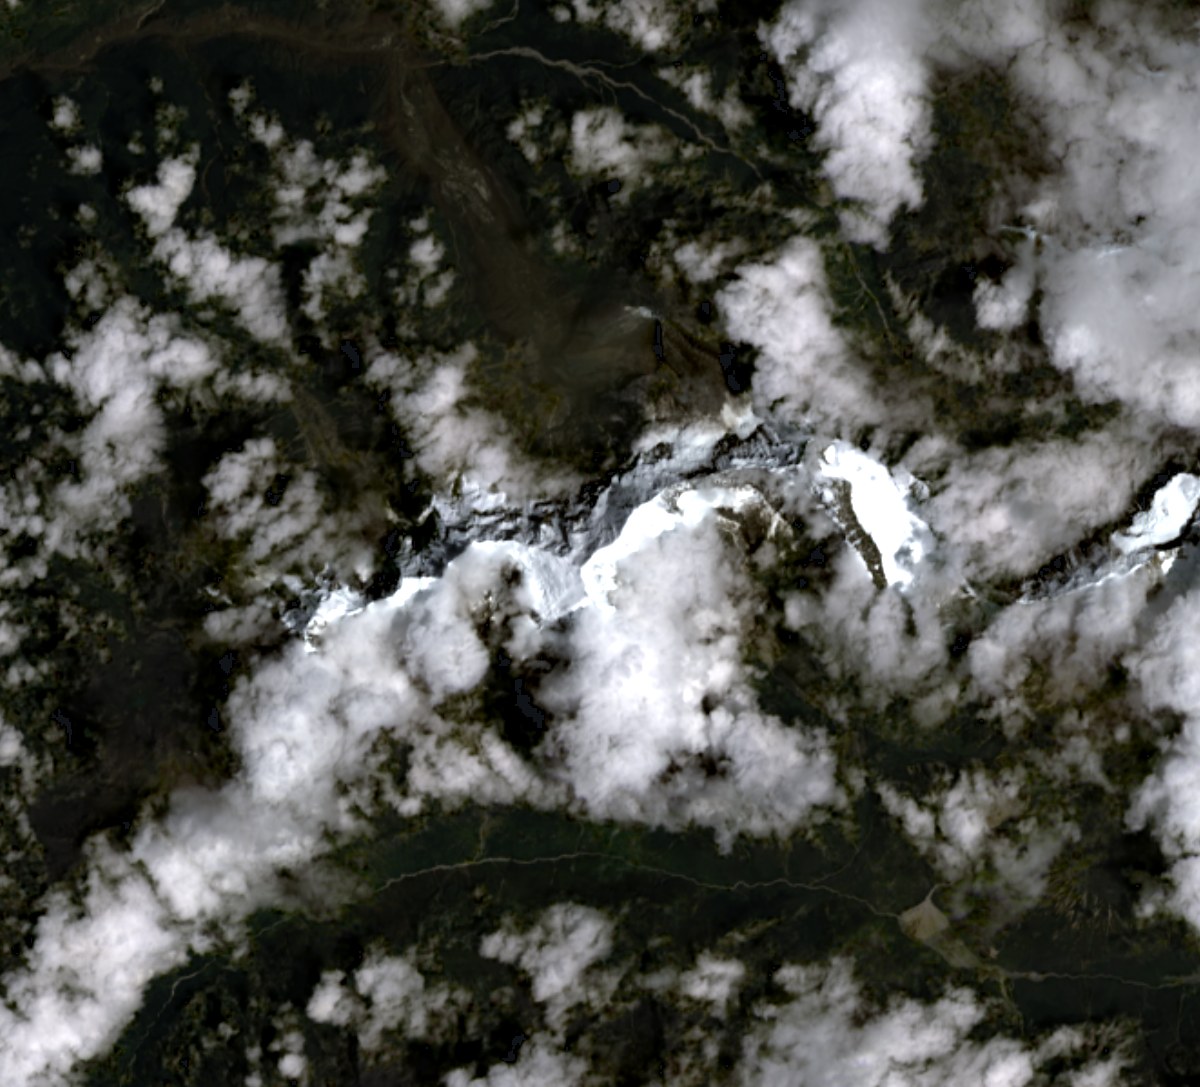
Vantor Open Data
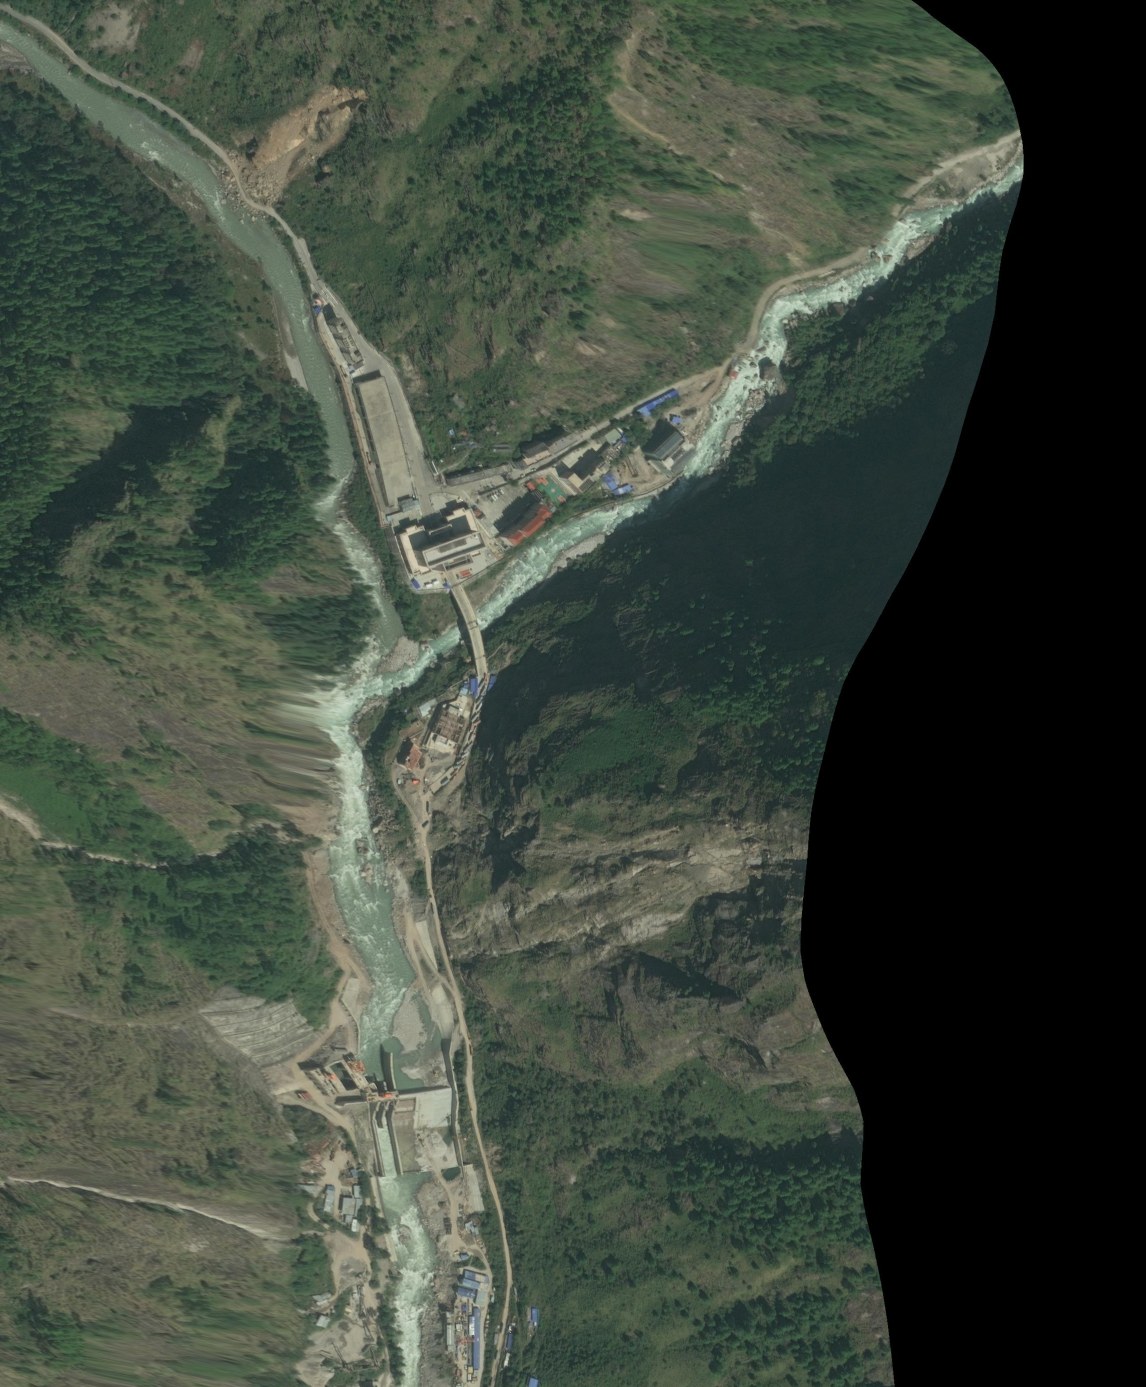
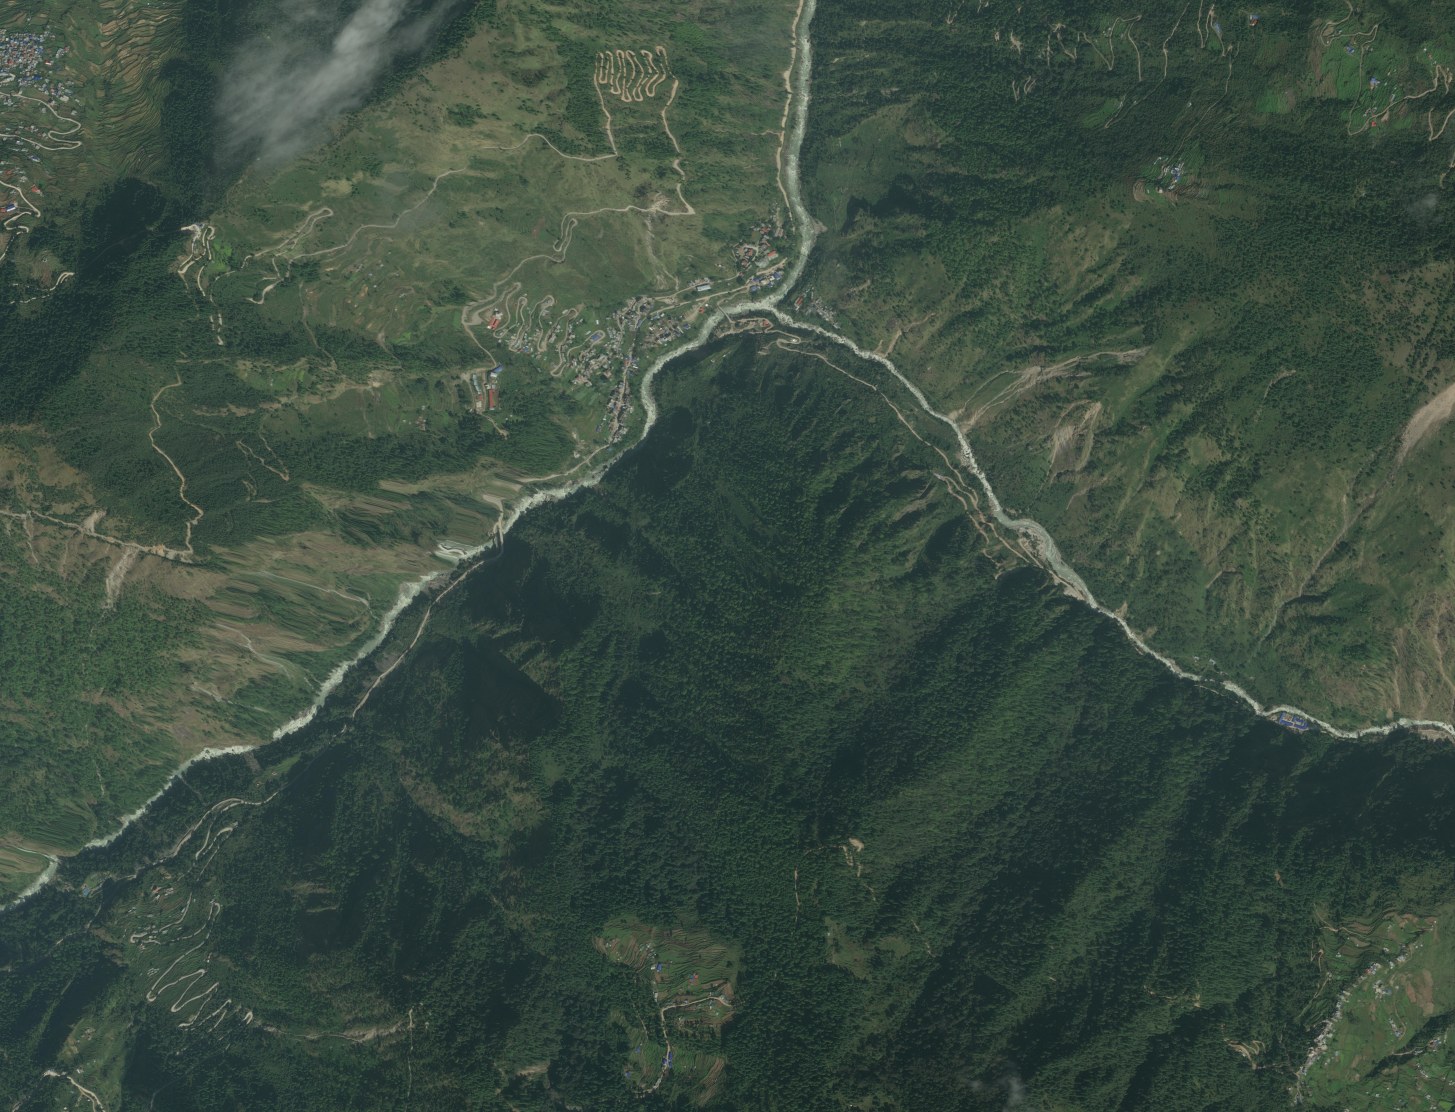
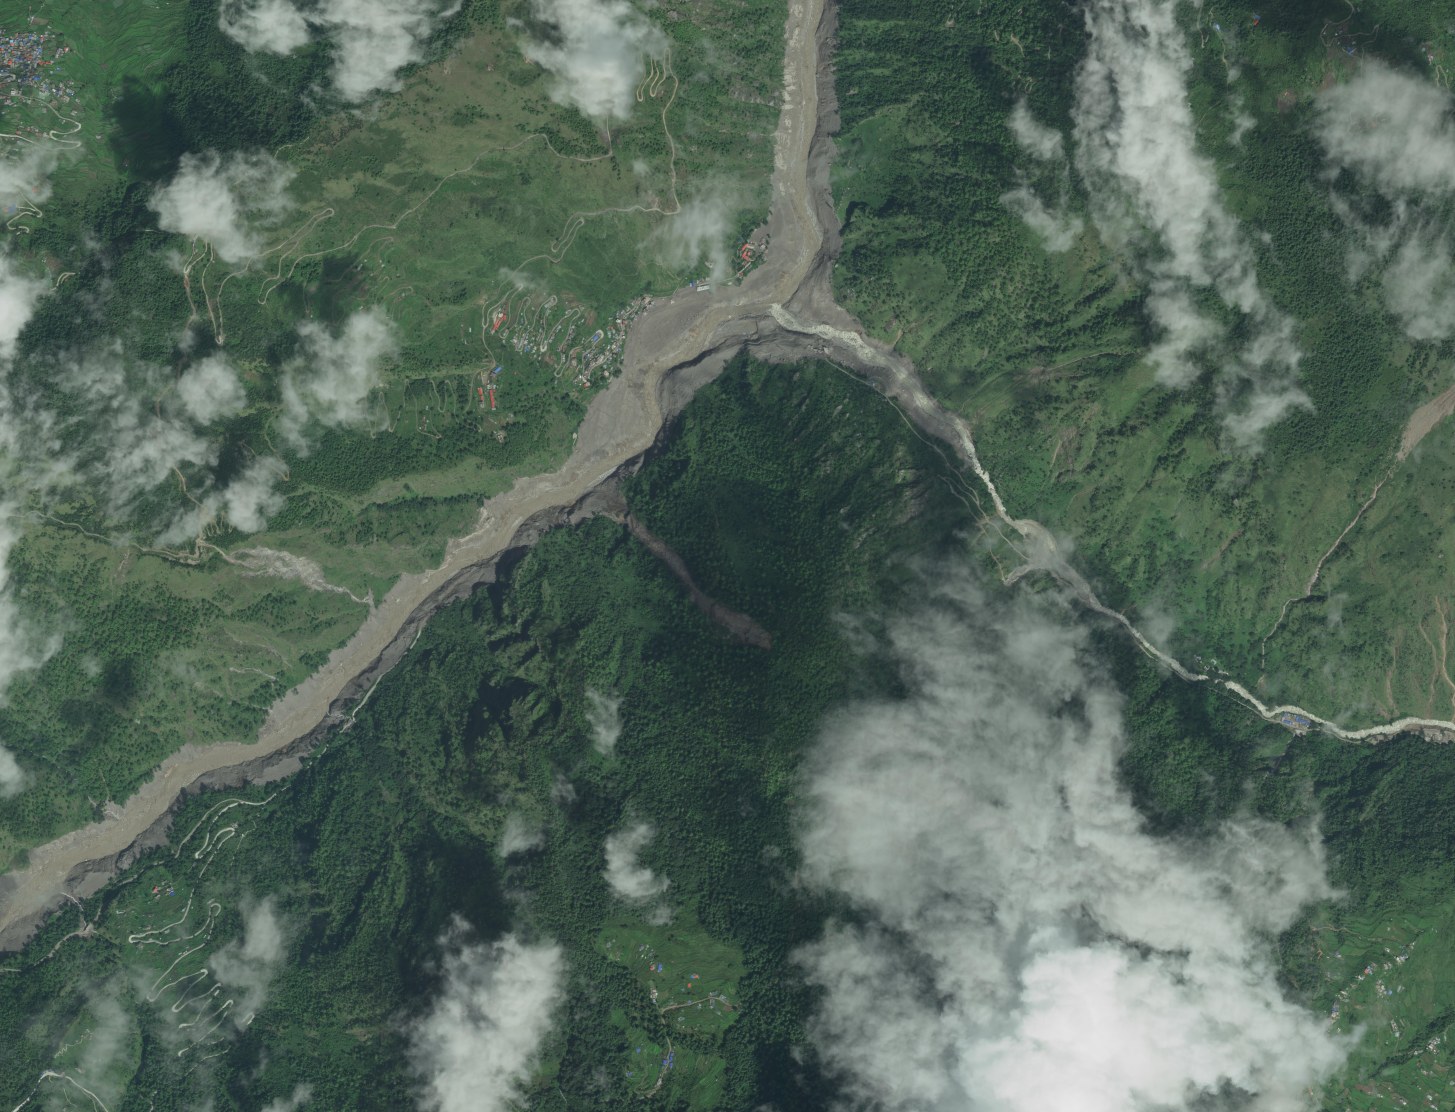
The Vantor (formerly Maxar) Open Data Program was activated on 27 August at the request of HOT, releasing WorldView Legion imagery at 0.3–0.5 m, one pass each on 27 and 28 August around 05:05 UTC. Nominal cloud cover is 71–81%, and much of the valley floor is visible through the gaps. The pre-event reference is a 2021 WorldView-2 archive scene.
The clip below covers the Rasuwagadhi crossing at native resolution:
 Pre-event 2021-10-16 WV02
Post-event 2026-08-27 WV Legion
Pre-event 2021-10-16 WV02
Post-event 2026-08-27 WV Legion
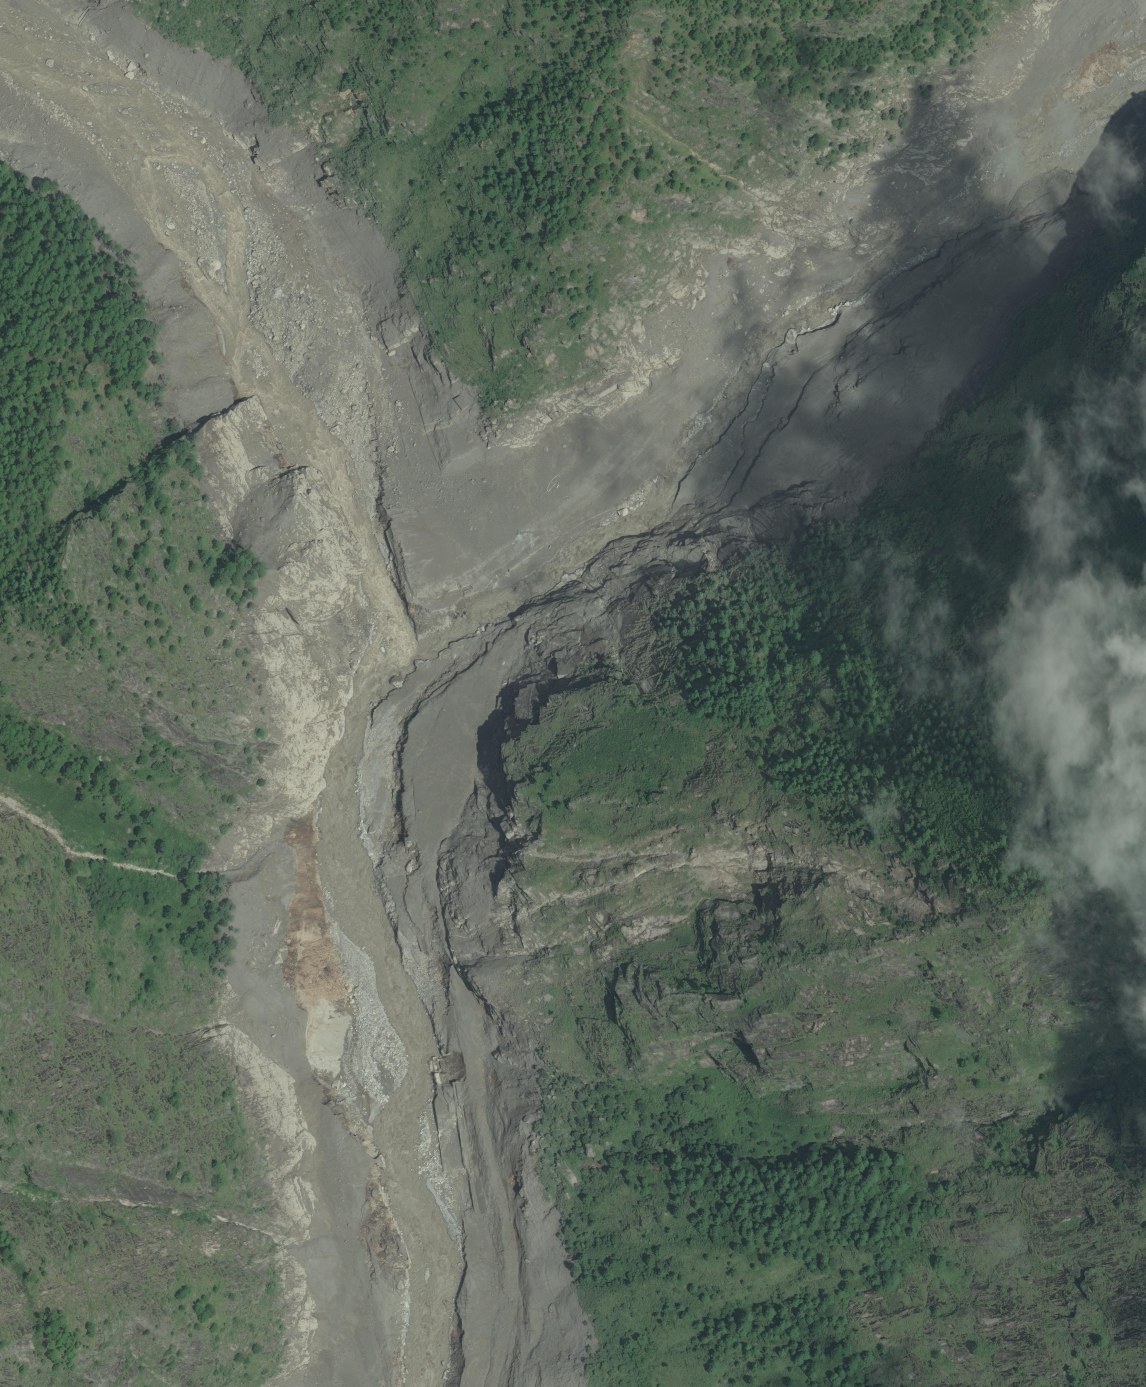
Downstream, Syabrubesi is the trekking staging town, located at the confluence of three rivers:
 Pre-event 2021-10-16 WV02
Post-event 2026-08-27 WV Legion
Pre-event 2021-10-16 WV02
Post-event 2026-08-27 WV Legion
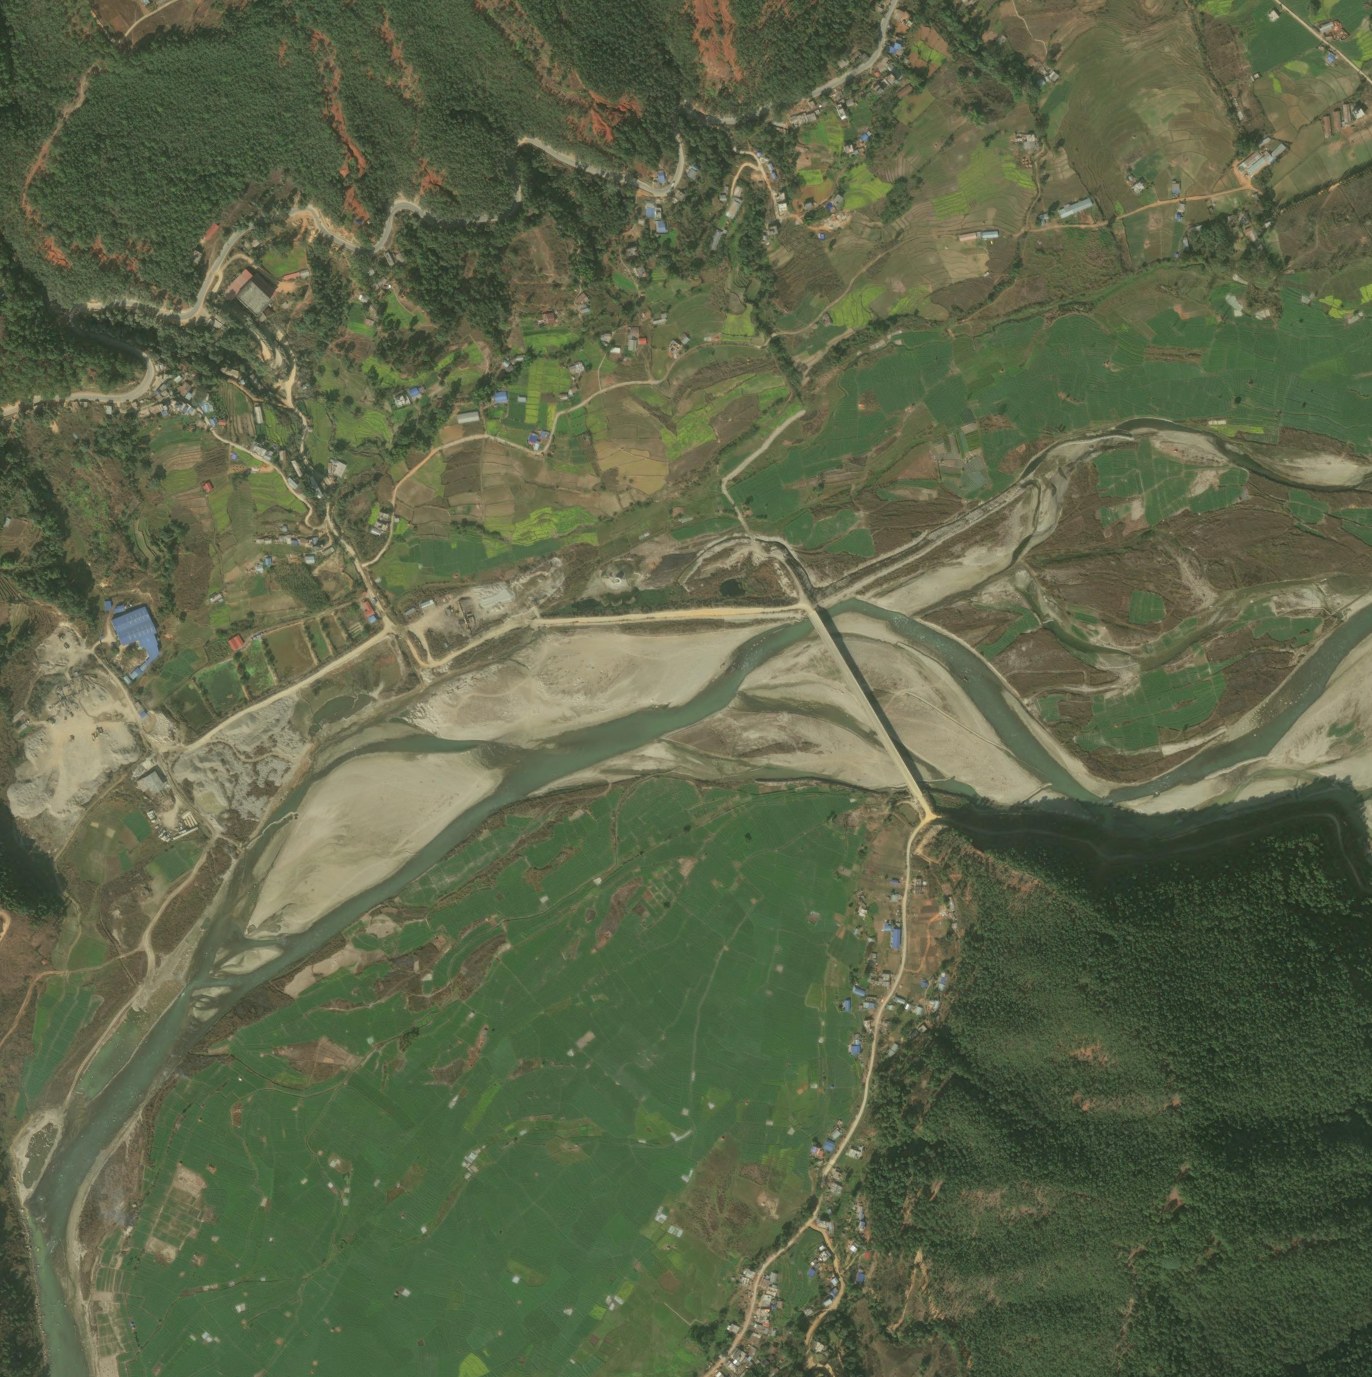
The Vantor release was later extended (on the evening of 28 August) to the downstream Trishuli reach: one post-event WorldView Legion scene from 08-28 05:07 UTC, and a cloud-free 2026-02-05 archive scene as the pre-event reference. Below is the Trishuli southeast of Bidur / Trishuli Bazar (around 85.16°E, 27.89°N, roughly 54 km line-of-sight southwest of Langtang Lirung):
 Pre-event 2026-02-05 archive
Post-event 2026-08-28 WV Legion
Pre-event 2026-02-05 archive
Post-event 2026-08-28 WV Legion
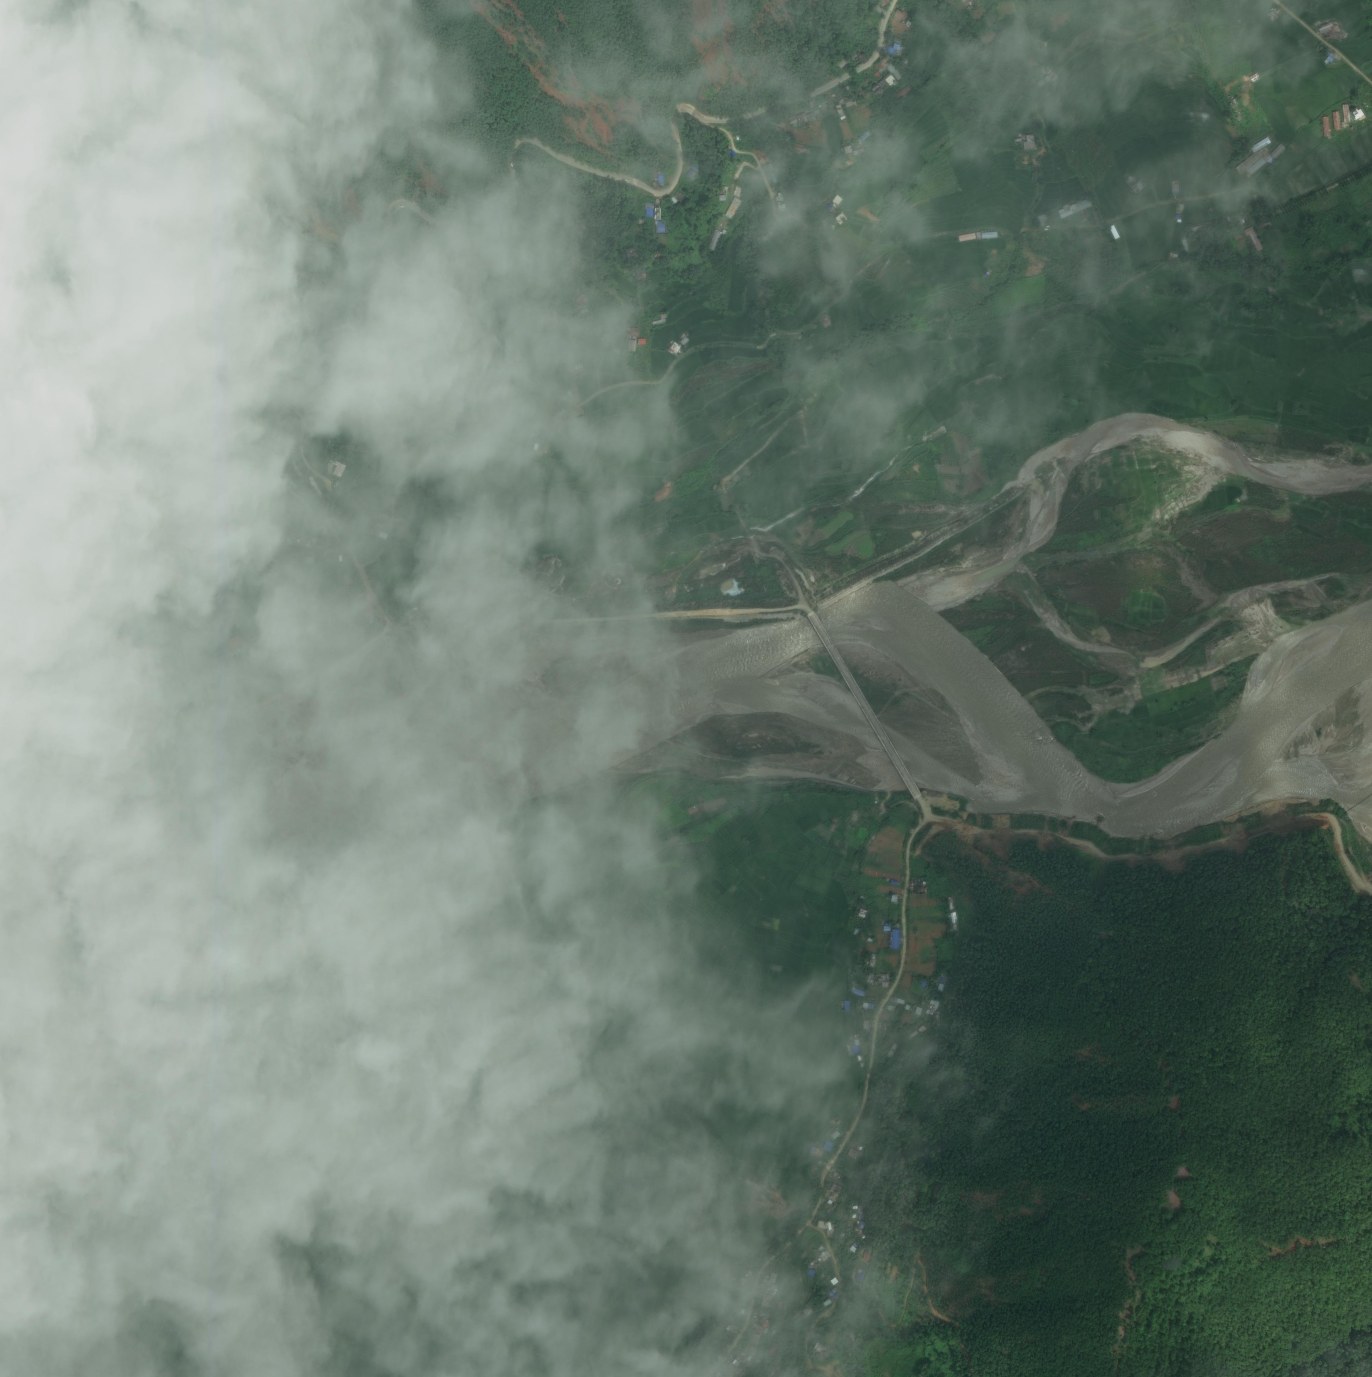
All of these readings are limited to cloud-free areas. The state of the road base under the cloud, whether landslide dams are present, and the full length of the deposit corridor are not visible in these images.
Next
Everything ingested up to 2026-09-10 is processed above: one cross-event pair on each of the Sentinel-1 tracks 85, 121 and 19, one post-to-post pair on path 85, and the three NISAR L-band geometries on paths 48, 98 and 149.
Extrapolating the 12-day revisit puts the next passes at: Sentinel-1 path 121 on 09-12 00:10 UTC, path 19 on 09-17 00:18 UTC, path 85 on 09-21 12:21 UTC; NISAR path 98 on 09-12 23:39 UTC and path 149 on 09-16 13:06 UTC.
Data sources and licensing
- Sentinel-1 RTC γ⁰: Copernicus Sentinel data, distributed via Microsoft Planetary Computer
- NISAR: products courtesy NASA/JPL-Caltech and ISRO, via ASF DAAC
- Landsat 9: USGS, public domain
- Planet imagery: © Planet Labs PBC, CC-BY-NC-4.0, via the Planet Crisis Response Program
- Vantor imagery: © Vantor, CC-BY-NC-4.0, via the Vantor Open Data Program