Note
This post was written with the assistance of Claude.
The point panel in xue shows a row labelled “TMP 2M · DEM” next to the model 2 m temperature. It moves the model 2 m temperature from the grid point to the DEM elevation of the pinned point. The original formula was:
| |
0.0065 K/m, or 6.5 K/km, is the mean tropospheric lapse rate of the International Standard Atmosphere.
On 2026-10-05 I placed the pin on the summit of Mount Fuji and compared the row with the AMeDAS observation there (3775 m). The corrected values from GFS 0.25°, GFS sflux and ECMWF IFS 0.25° were all about 5 °C too low, and the difference was nearly the same at every valid time that day.
To find out whether this was a bias at Mount Fuji alone or a bias of the correction itself, I took one week of historical forecasts in each of four seasons, ran the same comparison at about 3000 stations worldwide, and tried several alternative methods. The row in xue now uses the model pressure-level temperatures, with a near-surface anomaly that decays with height; that change is now live. The rest of this post records that process.
Below, Δz = station elevation − model grid elevation.
The Mount Fuji case
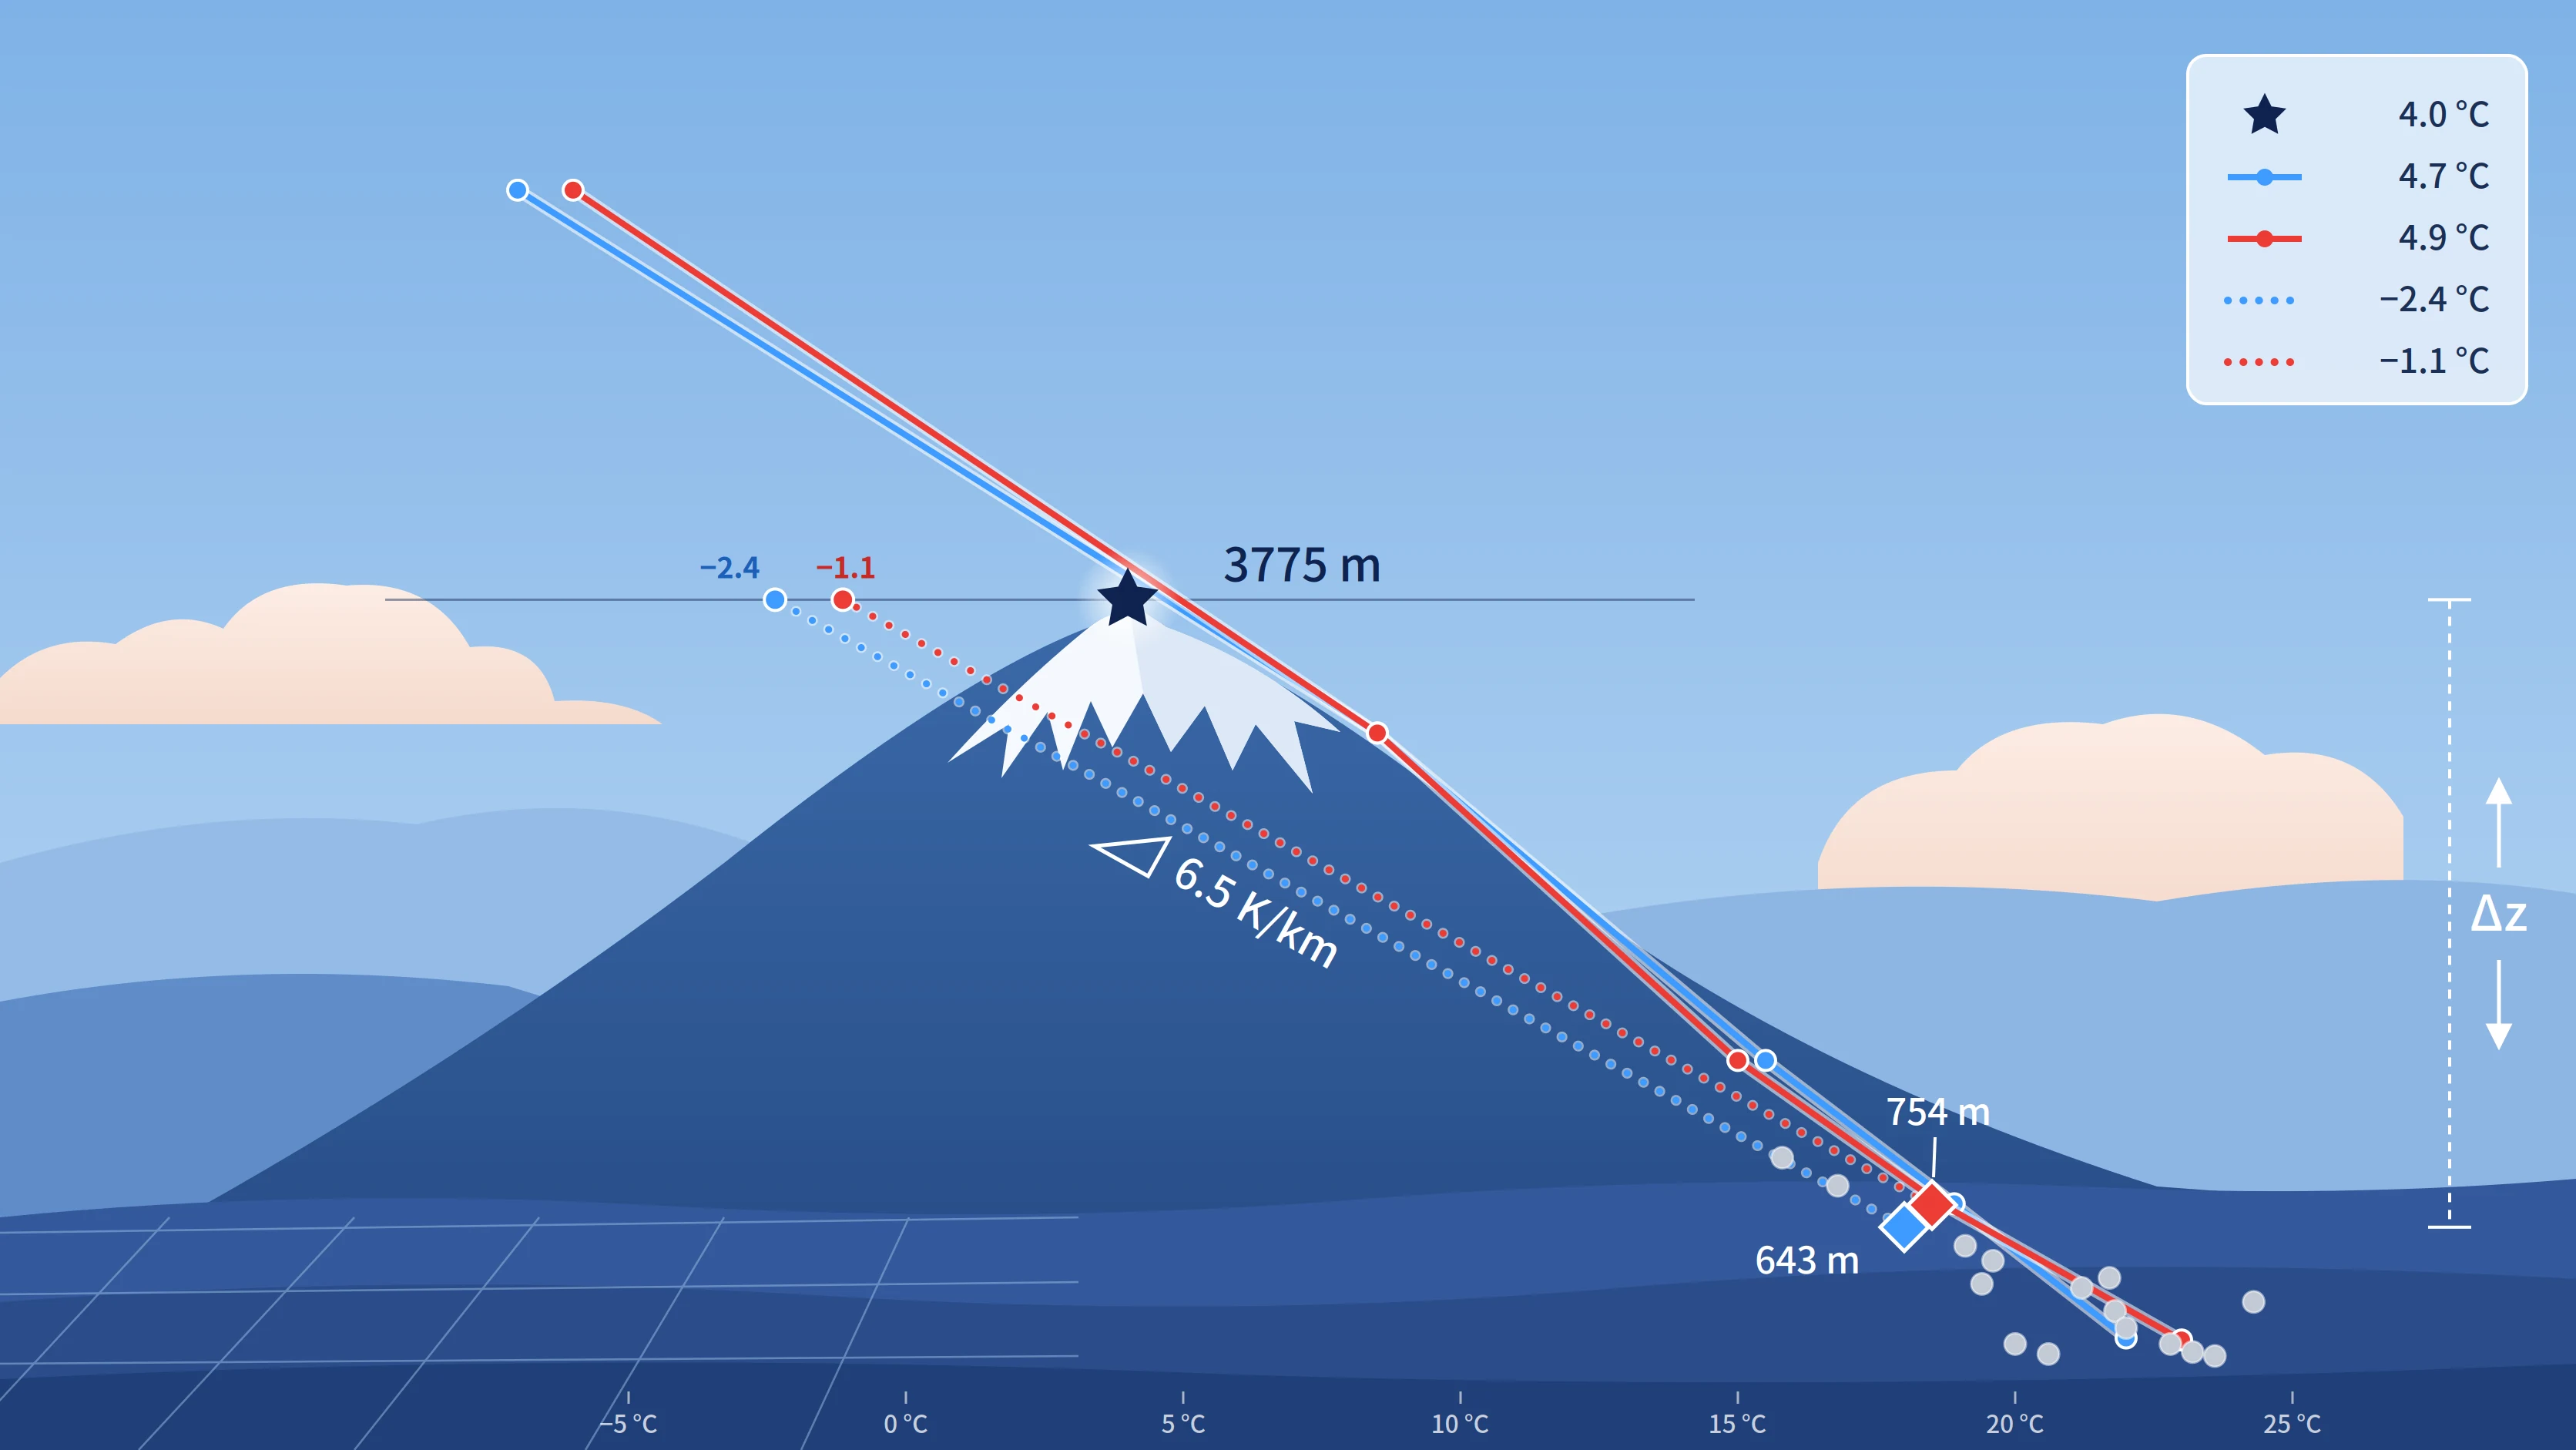
In the GFS 06Z, sflux 06Z and ECMWF 00Z forecasts of 2026-10-05, the model elevation of the grid point nearest the summit was 643 m, 976 m and 754 m. The highest of the surrounding grid points was 1100–1240 m. Model elevation on a 0.25° grid (about 25 km × 28 km) is a smoothed cell average. Mount Fuji is about 40 km across at its base, so heights near the summit do not exist on the grid. The correction therefore extrapolates about 3 km upward from 600–1000 m and amounts to −18 to −20 K.
Corrected minus observed was −6.1 ± 0.3 K for GFS (9 valid times), −6.0 ± 0.4 K for sflux, and −4.6 ± 0.5 K for ECMWF (5 valid times).
Temperature profile over Mount Fuji, 2026-10-05 09Z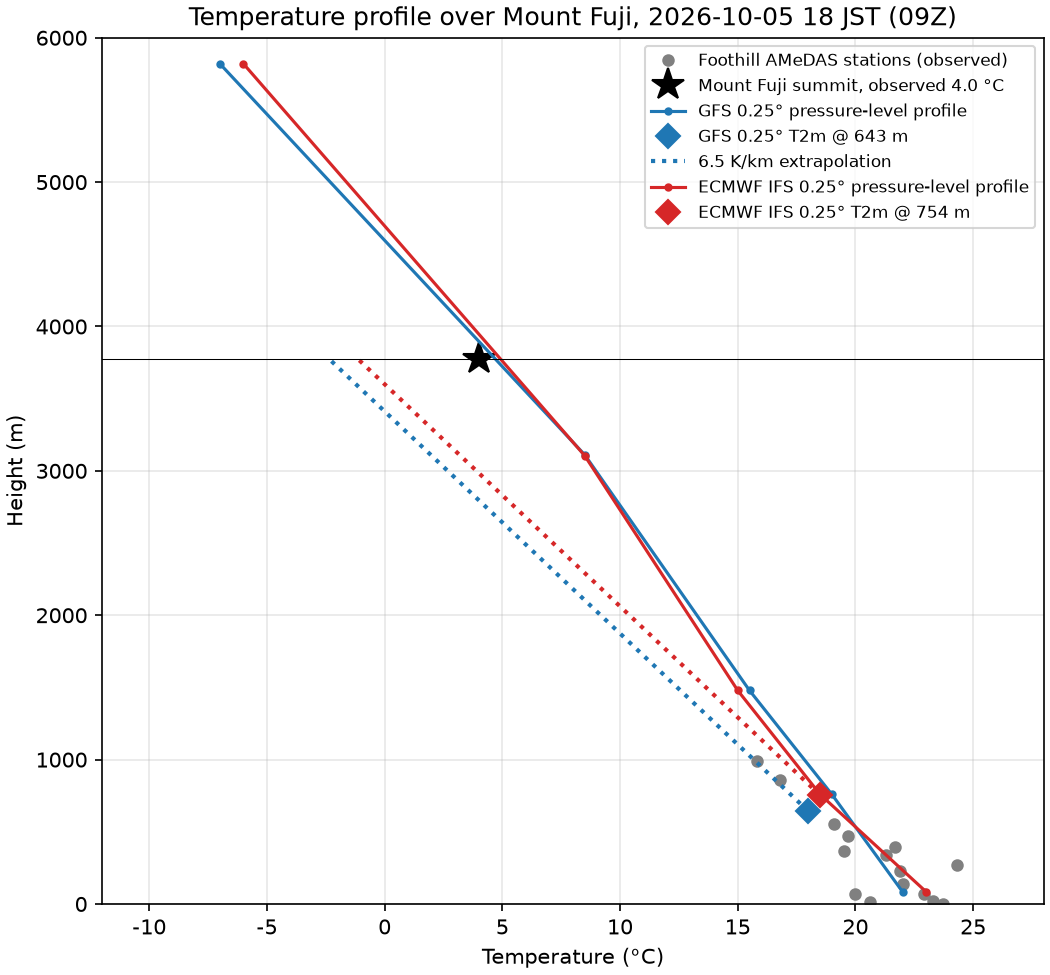
Solid lines are the model pressure-level temperatures. Diamonds are each model’s T2m at its grid elevation. Dotted lines extrapolate T2m to 3775 m at 6.5 K/km, and the star is the summit observation. At 3775 m the pressure-level profiles are within 1 K of the observation, while the 6.5 K/km extrapolation is about 6 K too cold.
The bias splits into three terms (averaged over valid times):
| Term | GFS | ECMWF |
|---|---|---|
| T2m minus the pressure-level temperature interpolated to the grid elevation | −1.3 K | +1.4 K |
| (6.5 K/km − the model column’s actual lapse rate) × Δz | −5.9 K | −5.5 K |
| Pressure-level temperature interpolated to 3775 m minus the observation | +1.0 K | −0.5 K |
| Total | −6.1 K | −4.6 K |
That day, the lapse rate of the model column from the grid elevation to 3775 m was 4.6–4.7 K/km. The lapse rate between 15 surrounding AMeDAS foothill stations (mean elevation 319 m) and the summit observation ranged over 4.0–5.0 K/km within 24 hours, with a mean of 4.45 K/km. Relative humidity at the summit was 98–100 % at most valid times. The moist-adiabatic lapse rate is about 4.1 K/km at 930 hPa and 20 °C, and about 5.0 K/km at 650 hPa and 5 °C.
The bias was stable that day because Δz is fixed by the grid, and within one air mass the lapse rate varied by only about ±0.5 K/km over the day. The four-season data later in this post show that the sign of the Mount Fuji bias changes with season.
Data and methods
The single-day check covered only one forecast cycle, so historical forecasts and observations were added:
| Item | Content |
|---|---|
| Period | 2024-10-08..14, 2025-01-08..14, 2025-04-09..15, 2025-07-09..15; one valid time every 3 hours, 224 in total |
| Forecasts | GFS 0.25° and ECMWF IFS open data 0.25°, 0, 3, 6 and 9 h forecasts from the latest 00Z/12Z cycle; byte-range reads from the GRIB2 archives on AWS using .idx / .index |
| Forecast fields | 2 m temperature, orography, temperature and geopotential height at 1000/925/850/700/600/500 hPa |
| Observations | NOAA ISD (SYNOP and METAR), gaps filled from GHCNh and IEM; the nearest report within ±30 min of the valid time |
| Stations | All active stations with |Δz| ≥ 200 m (1624), plus 1500 randomly chosen flat-terrain control stations |
| Excluded | 55 stations whose elevation or coordinates differ from the Mapterhorn DEM by more than 600 m, or whose coordinates duplicate another station |
| Sample size | 2968 stations, about 570,000 forecast–observation pairs |
The ISD station list ends in 2025-08 while NCEI migrates the dataset to GHCNh, so the period was taken from 2024-10 to 2025-07. ECMWF open data did not publish surface geopotential in 2024-10, so that week uses the 2025-01 orography. The orography fields of the other three weeks are identical to each other.
Corrections compared:
| Code | Name | Approach |
|---|---|---|
| M0 | No correction | T2m at the nearest grid point |
| M1 | 6.5 K/km | T2m − 6.5 K/km × Δz, the method xue used originally |
| M1b | 5.5 K/km | As M1 with 5.5 K/km (the value ECMWF adopted in its 2024 assimilation upgrade) |
| M8 | Bilinear + 6.5 K/km | As M1, with T2m and orography bilinearly interpolated from the 4 surrounding grid points |
| M2 | Pressure-level interpolation | Pressure-level temperature linearly interpolated in geopotential height to the station elevation, without T2m |
| M7 | RTMA-style | For Δz > 0, extrapolate with the model column lapse rate, capped at T2m |
| M5 | Decaying blend | For Δz > 0, the pressure-level temperature plus a near-surface anomaly that decays exponentially with Δz; for Δz ≤ 0, as M1 |
| M9 | Bilinear + decaying blend | M8’s bilinear interpolation plus M5, decay height H = 800 m; the method xue uses now |
The formula for M5 and M9:
| |
T_free(z) is the model pressure-level temperature linearly interpolated to height z. For Δz near 0 the result approaches T2m. For Δz much larger than H it approaches pure pressure-level interpolation. H is chosen by leave-one-week-out cross-validation: H is selected on three weeks and applied to the fourth.
Numbers in the text are for GFS unless stated otherwise. ECMWF shows the same pattern, and is mentioned separately where it differs noticeably.
Error as a function of Δz
Mean absolute error by Δz bin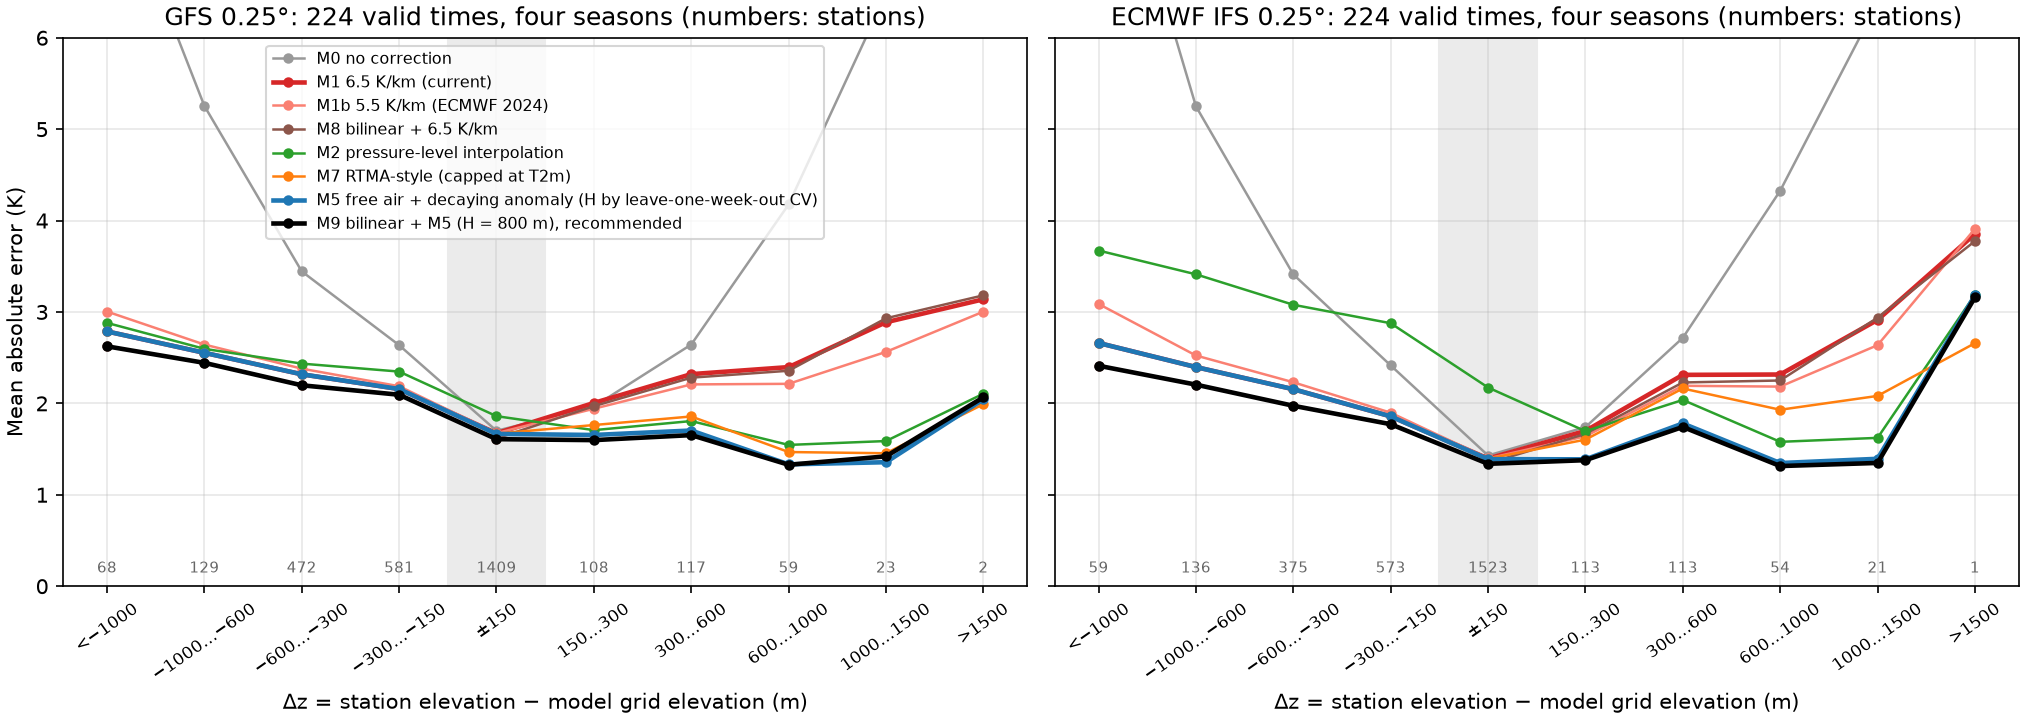
Mean absolute error (K) by Δz bin, GFS:
| Δz (m) | Stations | M1 6.5 K/km | M2 pressure-level interpolation | M9 bilinear + decaying blend |
|---|---|---|---|---|
| < −1000 | 68 | 2.79 | 2.88 | 2.62 |
| −1000…−600 | 129 | 2.55 | 2.60 | 2.44 |
| −600…−300 | 472 | 2.32 | 2.43 | 2.20 |
| −300…−150 | 581 | 2.16 | 2.35 | 2.09 |
| ±150 | 1409 | 1.67 | 1.86 | 1.61 |
| 150…300 | 108 | 2.00 | 1.71 | 1.60 |
| 300…600 | 117 | 2.32 | 1.81 | 1.65 |
| 600…1000 | 59 | 2.40 | 1.55 | 1.33 |
| 1000…1500 | 23 | 2.89 | 1.59 | 1.42 |
M0 (no correction) has an error of 6.5 K for Δz of 1000–1500 m and 8.0 K for Δz below −1000 m.
For |Δz| ≤ 150 m, all methods except M2 are within 0.1 K of each other, and the error comes mainly from the forecast itself. For Δz of 150–300 m, M9 is 0.4 K lower than M1. At the 201 stations with Δz > 300 m, the mean absolute error is 2.42 K for M1 and 1.53 K for M9, and the mean bias goes from −1.30 K to −0.21 K. Over all stations, M1 scores 1.99 K and M9 1.85 K. For ECMWF, the 189 stations with Δz > 300 m go from 2.40 K to 1.58 K, and all stations from 1.72 K to 1.58 K.
M2 (pressure-level interpolation) is 0.2 K worse than M1 for |Δz| ≤ 150 m, and 0.8 K worse for ECMWF; for Δz < 0, ECMWF is 0.9–1.0 K worse. Pressure-level temperatures below the model ground are extrapolated values, a point the TopoSCALE paper also makes.
Day–night difference at stations above the model ground
Mean bias at Δz > 300 m by season and time of day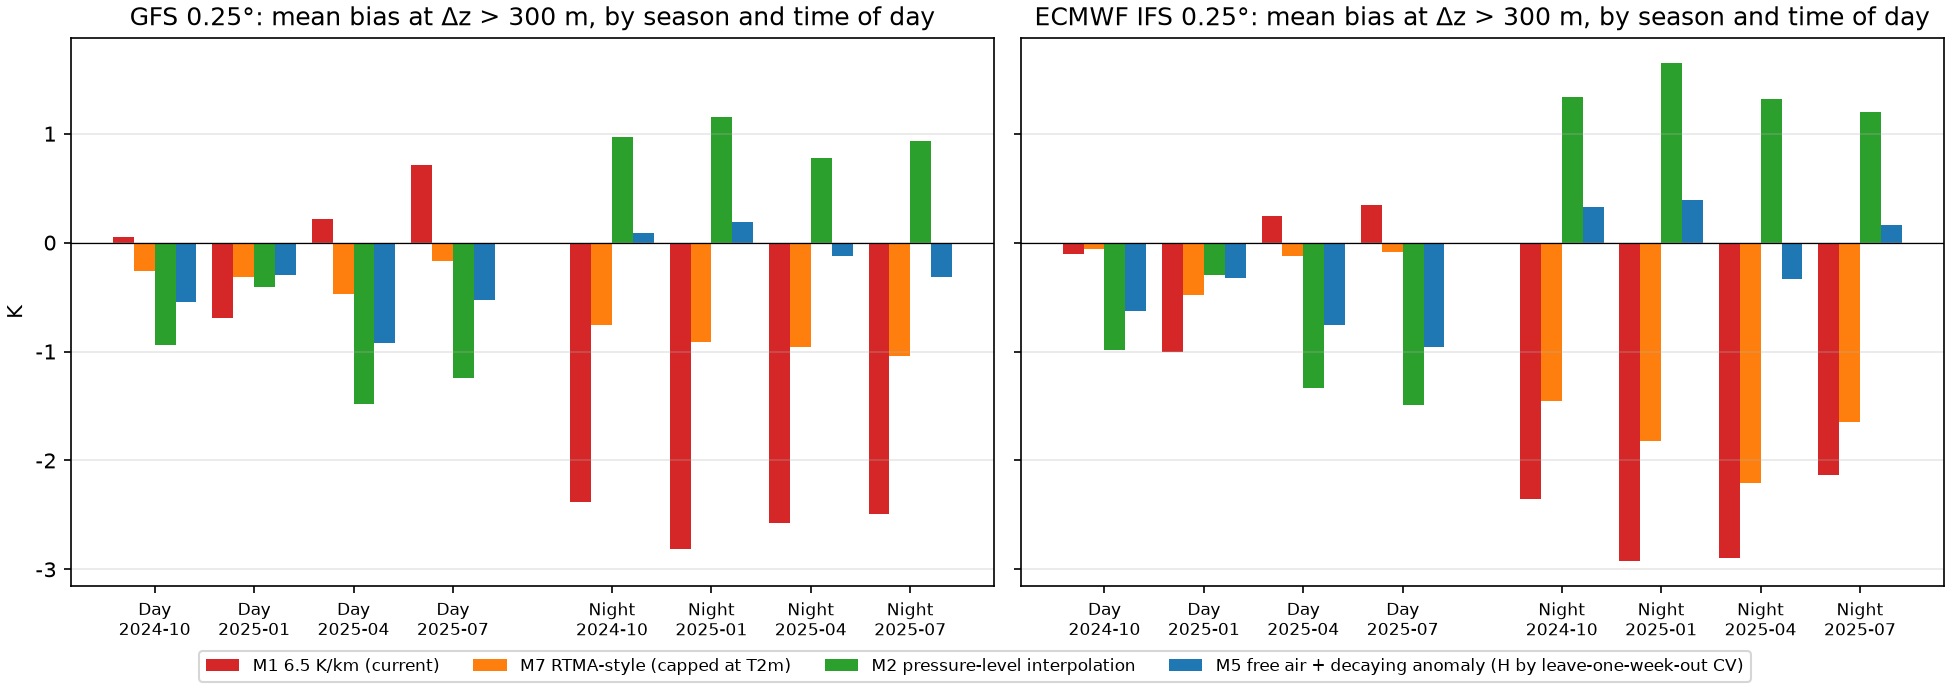
For stations with Δz > 300 m, grouped by local solar time into day (09–17) and night (21–05), the mean bias for GFS (K) is:
| Season | M1 day | M1 night | M5 day | M5 night |
|---|---|---|---|---|
| 2024-10 | +0.05 | −2.39 | −0.54 | +0.09 |
| 2025-01 | −0.69 | −2.81 | −0.30 | +0.19 |
| 2025-04 | +0.22 | −2.57 | −0.92 | −0.12 |
| 2025-07 | +0.71 | −2.49 | −0.52 | −0.32 |
M1 (6.5 K/km) is too cold at night in all four seasons, by 2.1–2.9 K across both models, and within ±1 K during the day. M5 (decaying blend) stays within ±1 K both day and night. M2’s (pressure-level interpolation) night bias has the opposite sign, +0.8 to +1.7 K. M7 (RTMA-style) is still 0.8–2.2 K too cold at night.
Effective lapse rate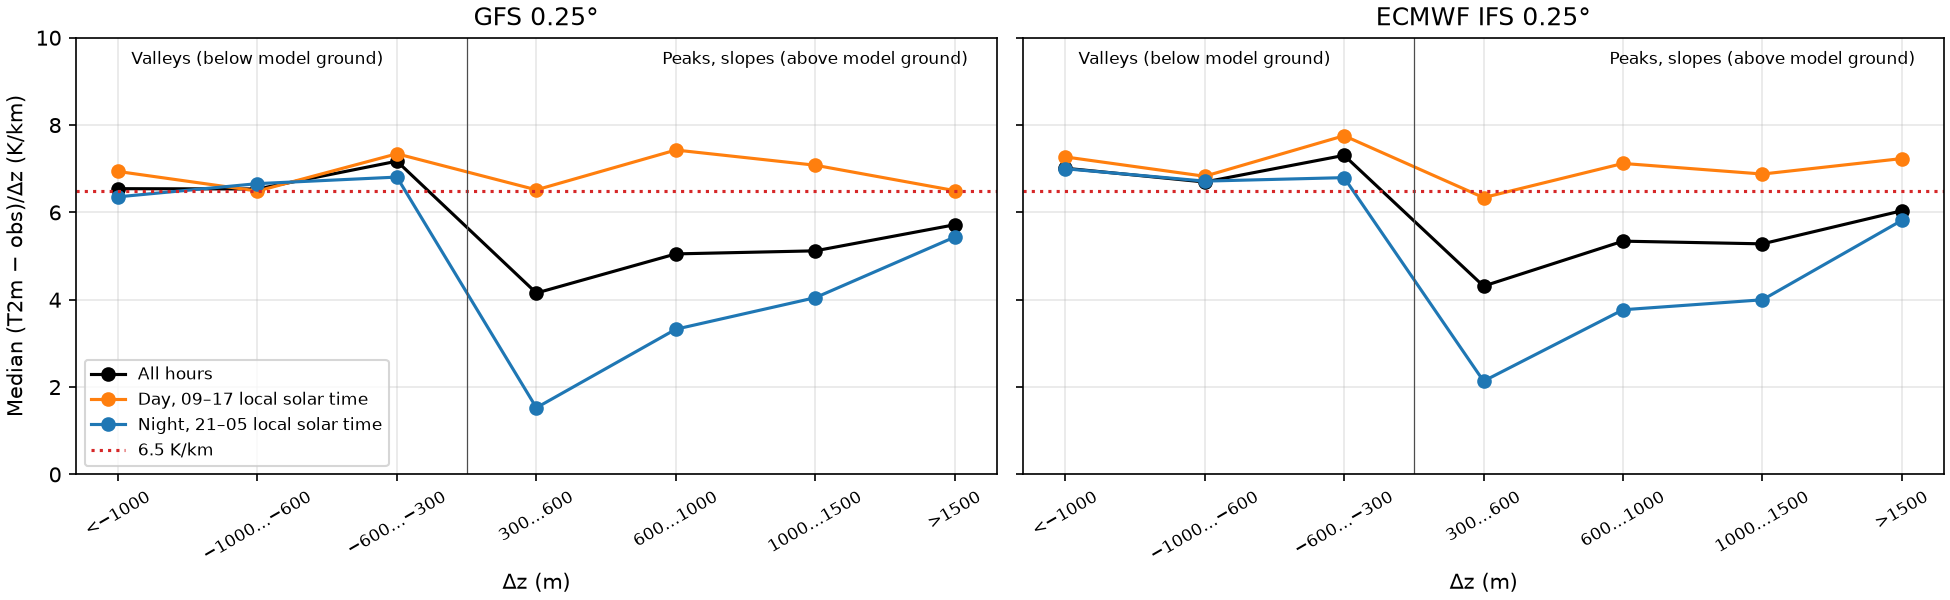
The effective lapse rate in the figure is (T2m − observed) / Δz, the lapse rate that would give M1 zero bias. For stations with Δz of 300–1500 m, the daytime median is 6.3–7.4 K/km and the night median 1.5–4.1 K/km, lower for smaller Δz. For stations with Δz < −300 m, both day and night fall between 6.4 and 7.8 K/km.
Night bias versus cloud cover at Δz > 300 m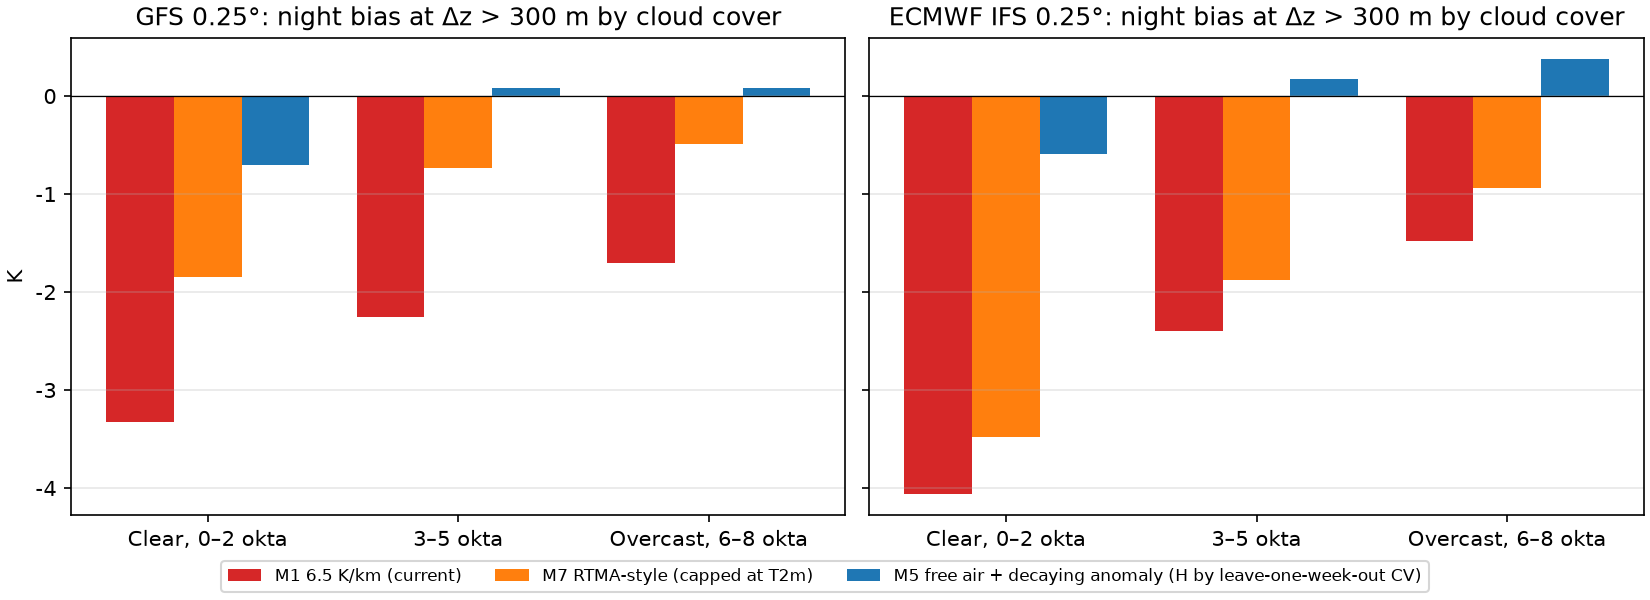
Grouped by observed cloud cover, the night bias of M1 at Δz > 300 m is −3.32 K for 0–2 okta, −2.26 K for 3–5 okta and −1.70 K for 6–8 okta. M5’s bias in the same groups is −0.71, +0.08 and +0.08 K. Grouped by observed wind speed into 0–2, 2–5, 5–10 and > 10 m/s, M1’s bias is −2.2, −2.9, −2.7 and −2.2 K, with no monotonic relation to wind speed.
These results are consistent with the following process. T2m at the model grid elevation carries the near-surface layer’s daytime heating and nighttime radiative inversion. Extrapolating with a fixed lapse rate carries that signal to stations several hundred metres or more above the model ground, which sit above the near-surface layer. The largest bias on clear nights matches the strength of radiative inversions. The mechanism was not verified directly against boundary-layer observations.
Decay height
Decay height H versus RMSE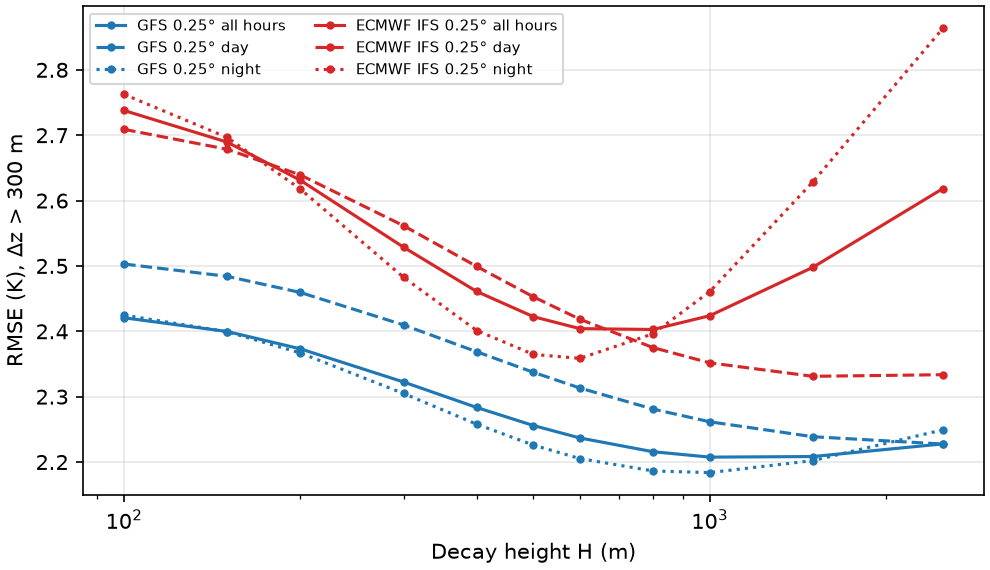
Leave-one-week-out cross-validation selected H = 1000, 1000, 1000 and 1500 m for GFS over the four weeks, and 600, 600, 800 and 600 m for ECMWF. RMSE over the full sample varies little with H: 2.21–2.22 K for GFS between 800 and 1500 m, and 2.40 K for ECMWF between 600 and 800 m. With H = 800 m both models are within 0.01 K of their own optimum. Separate day and night values of H improve RMSE by no more than 0.05 K.
Summits and the free atmosphere
Mean absolute error at representative summit stations (ECMWF)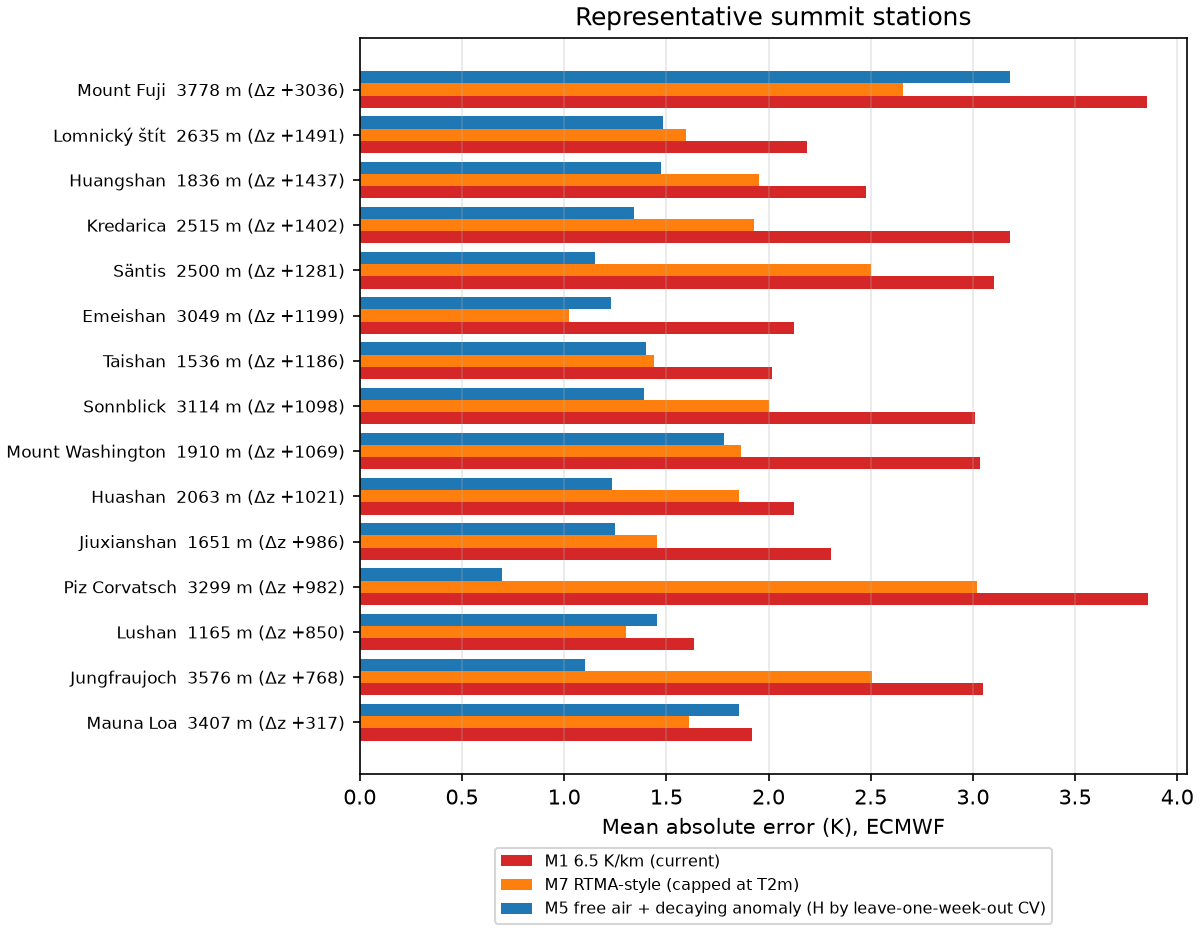
At 9 summit stations (Mount Fuji, Jungfraujoch, Säntis, Sonnblick, Kredarica, Mount Washington, Huangshan, Huashan and Piz Corvatsch), M9’s mean bias in the 2025-01 week is +1.6 K, and 0.0 to +0.4 K in the other three weeks. To tell whether this error comes from the model free atmosphere or from the summit stations, I interpolated IGRA2 radiosonde profiles to the summit elevations and compared them with the summit observations and with the model pressure-level temperatures:
| Summit station | Radiosonde station | Observed − sonde, all | Observed − sonde, 2025-01 |
|---|---|---|---|
| Mount Washington | Gray, ME | −3.09 °C | −5.42 °C |
| Säntis | Payerne | −1.67 °C | −3.42 °C |
| Mount Fuji | Tateno | −1.43 °C | −1.83 °C |
| Huangshan | Anqing | −1.30 °C | −2.13 °C |
| Kredarica | Ljubljana (06Z) | −0.87 °C | −3.12 °C |
| Taishan | Jinan Zhangqiu | −0.37 °C | −0.48 °C |
| Mauna Loa | Hilo | +0.34 °C | +0.04 °C |
Taking the model column at the radiosonde sites, GFS and ECMWF agree with the soundings to within ±0.3 °C in every season, with the largest difference −0.7 °C at Payerne in 2025-01. In winter the summit stations are 2–5 °C colder than the free atmosphere at the same height; in summer the difference is 0 to −1 °C. Mount Fuji is far from Tateno and there is a horizontal temperature gradient between the two in winter. Against the model free atmosphere at the Mount Fuji grid point, the 2025-01 observations at Mount Fuji are about 4.3 °C lower. Mauna Loa is 3.3 °C warmer than the free atmosphere at 00Z (14 local time) and 2.65 °C colder at 12Z (02 local time).
The causes of this difference (radiative cooling over snow, adiabatic cooling of flow over the mountain, and others) were not separated in this data set. The abstract of Sheridan et al. (2018) states that summit temperatures are higher than over flat ground and lower than in the free atmosphere at the same height, the same direction as observed here.
The M1 bias at Mount Fuji by season (ECMWF) is: 2025-01 day +3.5 K and night −0.5 K; 2025-04 day +1.2 K and night −1.8 K; 2025-07 day −5.8 K and night −5.0 K. Neither ISD nor GHCNh has Mount Fuji observations for the 2024-10 week. The bias of about −5 °C described at the start appears only in the warm, humid season.
Valleys
For stations with Δz < −300 m, M1’s mean bias over the four weeks is between −0.9 and +0.9 K. With constant lapse rates of 4.5, 5.0, 5.5, 6.0 and 6.5 K/km, ECMWF’s mean absolute error is 2.62, 2.49, 2.39, 2.31 and 2.26 K, smallest at 6.5 K/km. At stations with Δz > 300 m, M1b (5.5 K/km) is 0.14–0.16 K better than M1, and in valleys it is 0.08–0.13 K worse.
M2 and the model column lapse rate are both worse than M1 in valleys. M8’s bilinear interpolation lowers the mean absolute error in valleys by 0.06–0.25 K, more for more negative Δz. A 0.25° grid does not resolve valley cold pools. Methods that improve valleys, such as REDCAPP and Lundquist et al. (2008), use DEM terrain indices; they were not tested here.
How xue applies it
xue now uses M9:
- When the pin is above the model ground, it uses the decaying blend. The free-atmosphere temperature is interpolated to the pin’s DEM height from the cycle’s published 1000–500 hPa temperatures and geopotential heights; the difference between T2m and the free-atmosphere temperature at the model ground is added, multiplied by exp(−Δz / 800 m).
- When the pin is below the model ground, it still uses 6.5 K/km.
T2m and model orography are bilinearly interpolated from the 4 grid points around the pin, matching how the map shader filters them; the pressure-level column is taken at the nearest grid point, as in the verification. If a cycle has fewer than two pressure levels available, it falls back to 6.5 K/km.
With terrain on, the map applies the same correction to every pixel in the view, and the “TMP 2M · DEM” row in the point panel uses the same formula. Exposed summits are colder in winter than the free atmosphere at the same height; this method does not remove that bias, and the corrected values there are still too warm.
Relation to existing methods
M5 has the same structure as REDCAPP: the free-atmosphere temperature at the station height plus a near-surface anomaly carried up from the model ground. REDCAPP fits its weight from DEM landform indices; the weight here depends only on Δz. M2 is the TopoSCALE approach. Gao et al. (2012) switch the starting point of the extrapolation to T850 above about 1500 m, which is equivalent to switching the weight from 1 to 0 at 1500 m. CHELSA-W5E5 and ERA5-Land (Dutra et al., 2020) use a daily lapse rate from the model column. M7 is the RTMA approach. RTMA runs on a 5 km grid, where stations are generally tens to hundreds of metres from the model ground and mostly lie inside the near-surface inversion; most stations with Δz > 300 m here lie above it. This may be why M7 is still too cold at night on a 0.25° grid; not verified. Met Office IMPROVER regresses T2m on model orography within a neighbourhood to get a lapse rate; it was not tested here.
Among the literature found, REDCAPP, TopoSCALE and CHELSA are verified on daily reanalysis values, and Sheridan et al. on the 4 km Met Office UM. No work was found that verifies 0.25° GFS and IFS hourly, binned by Δz.
Data issues
- In the AWC station files
stations.cache.jsonandmetars.cache.csv, about 20 small US airports list elevation in feet, for example 3680 for KO26 Lone Pine (actually 1122 m) and 8680 for KC24 Creede (actually about 2646 m). xue’s airport product used this field directly. - In the ISD station list, several North Sea offshore platforms have an elevation of 470 m, and the elevation or coordinates of Herbert Island, Inguincho, Lahsh, Gupis, Jorhat, Mestia and others differ from the DEM by more than 600 m. 13 pairs of stations, such as Snezka 11653 and Sniezka 12510, share the same coordinates.
- Most summit stations in ISD have coordinates with a precision of about 0.01°, which can land on a slope and differ from the DEM by 200–400 m.
- French high-mountain stations often mount the sensor about 7 m above ground (Préaux et al., 2025). Sensor heights of the Chinese and Japanese summit stations used here were not checked.
Data sources
- NOAA GFS, NOAA ISD / GHCNh, AWC METAR, IGRA2: US public domain data.
- ECMWF open data: Copyright © ECMWF, CC BY 4.0. The data were interpolated and statistically processed for this post.
- AMeDAS: Source: Japan Meteorological Agency website (PDL 1.0), statistically processed for this post.
- IEM ASOS archive: Iowa Environmental Mesonet.
- Mapterhorn DEM: © Mapterhorn.
- Forecast data were read from the AWS buckets
noaa-gfs-bdp-pdsandecmwf-forecastson 2026-10-06.