In ColorfulClouds App and ColorfulClouds Weather API, we could get current GPS
location’s weather alert information, such as “Gale Blue Alert”. Different
countries and regions have different rules for issuing alerts. In China, it is
issued according to the administrative division level, and the smallest is the
county-level administrative division. Therefore, in the implementation, it is
necessary to convert the GPS location into the administrative division level
information, and then find the relevant alert information.
Early users of ColorfulClouds App and ColorfulClouds Weather API may know that
for a long time, the meteorological warnings displayed by ColorfulClouds are
often inconsistent with the administrative division. This is very bad for user
experience and toB customers:
When people are in Changping, they see Haidian warning
When people are in Haidian, they see Chaoyang warning
When people are in Chaoyang, they see Tongzhou warning
Ashamed to say, this calculation idea is very simple: Traverse each adcode
center point to calculate which is the nearest adcode, which is simple and rude.
It is similar to the weather station data query in the previous section, and it
is not complicated to understand. Limited by the team situation at the time,
there is no solution before 2021. The overall accuracy index has not been
evaluated, and it was optimistic that it was about 70% to 80% (a big mistake).
Later, as the team grew and user feedback increased, we decided to start working
on this problem. At that time, the idea was that if the grid of each kilometer
in the country was pre-calculated, would it be accurate enough? Quad grid with
latitude and longitude, or something else?
Grab 2018 GopherChina Sharing provides a reference:
Geohash will be distorted in the equatorial region, and the area represented by
the same resolution is very different in the mid-latitude and equatorial
regions. result in worse results. Although the mainland of China is at
mid-latitudes, considering that the north-south span is not small, It is best
that the actual area represented by the same resolution is close, so that the
same resolution can be used. So Geohash was ruled out.
S2 is a geographic index system that I have been paying attention to for a long
time The advantage is:
Stable: S2 has withstood the test of Google Maps for many years
Algorithm design: the parent node must contain exactly four child nodes (this
will be very important afterwards)
Disadvantages:
Full API implemented only in C++
Go implements the algorithm from scratch, and the project activity is worrying
Compared with before, Uber H3 It is serious about doing open source (it has a
lot of use in data analysis scenarios). And there are ready-made packages for
each language. After searching, I found that Uber, Grab, and Didi are all using
hexagons as geographic indexes. And we have already used H3 in some businesses
in the production environment. That’s it. The point of view at the time was that
we were closer to these ride-hailing companies in terms of geographic data
processing, being sensitive to distance/range and less sensitive to boundaries.
Download polygon files from the internet, use Uber H3’s Polygon Fill method with
resolution set to 9, and fill polygon areas with H3 small grids.
Red shows the original grid, blue shows after aggregation
We built a validation dataset A using public data (containing only
latitude/longitude and adcode), and found that the first generation accuracy was
around 50%. The red grid achieved 90%+ accuracy, showing very significant
improvement. After launch, we also exposed administrative division level
information in the v2.6 version of the API.
The disadvantages of this implementation are obvious:
High memory usage, 200MB memory overhead?
The generation and maintenance of Geo polygon files and H3ID JSON files are
manually implemented, not very engineered
The file itself is large, less than 20MB, and there is no separation of code
and data
At the end of November 2021, users reported that they were not receiving local
warning messages. We checked the nearby grid data and found unexpected
situations:
Adjacent grids
The user was on the boundary line of the administrative division. Due to grid
aggregation, the details of the entire shape were lost, causing the user’s
location to be classified into another adjacent grid. Especially since H3’s
upper and lower layers cover approximate areas rather than complete containment
relationships, the grids won’t be as accurate at boundaries, so this method
can’t be used:
In use cases where exact boundaries are needed applications must take care to
handle the hierarchical concerns. This can be done by taking care to use the
hierarchy as a logical one rather than geographic. Another useful approach is
using the grid system as an optimization in addition to a more precise
point-in-polygon check.
We initially tried increasing the resolution for finer granularity, but still
couldn’t contain everything because boundary range details are difficult to
aggregate unless precision is increased to tens of meters level, which would
create too much memory pressure. The only option left was to tackle polygon
searching.
Theoretically, how do you determine if a point is inside a polygon? This problem
is formally called Point in polygon, or PIP for short. The
mathematical algorithm is called Ray casting, and the
determination condition is: if the number of intersections between a ray cast
from the point and the polygon is always odd, then the point is inside the
polygon:
However, when implementing in code, we need more than just the algorithm - we
need to consider various edge cases, execution efficiency, etc., requiring a
mature and reliable solution. We researched some community open-source algorithm
implementations and found that the geographic calculation component used by the
Tile38 database best met our needs. Particularly, in 2018 the author developed
polygon pre-indexing optimization, which stores an index
structure based on RTree along with the polygon data, dividing the entire
polygon into many small quadrilaterals, thereby achieving faster Point in
Polygon determination. So based on previous work, we implemented high-precision
latitude/longitude to administrative division conversion that wasn’t too slow
using administrative division polygon data.
If there’s anything I wish I had studied beforehand, it would be
RFC 7946. The entire GeoJSON file definition is clearly defined
through this document.
For example, we would have considered more when dealing with an administrative
division having two polygons. We didn’t notice this initially, like with
Qingshanhu District:
青山湖
Later, as time went on, we rebuilt the validation dataset once and compared the
historical implementations with the latest version:
Version
Accuracy
v1
56.5%
v2
88.8%
v3
97.4%
Production environment:
Memory usage: 728MB
Startup time: 5.6s, originally 5.2s, +0.4s
API latency: 1.9ms, originally 1.5ms, +0.4ms
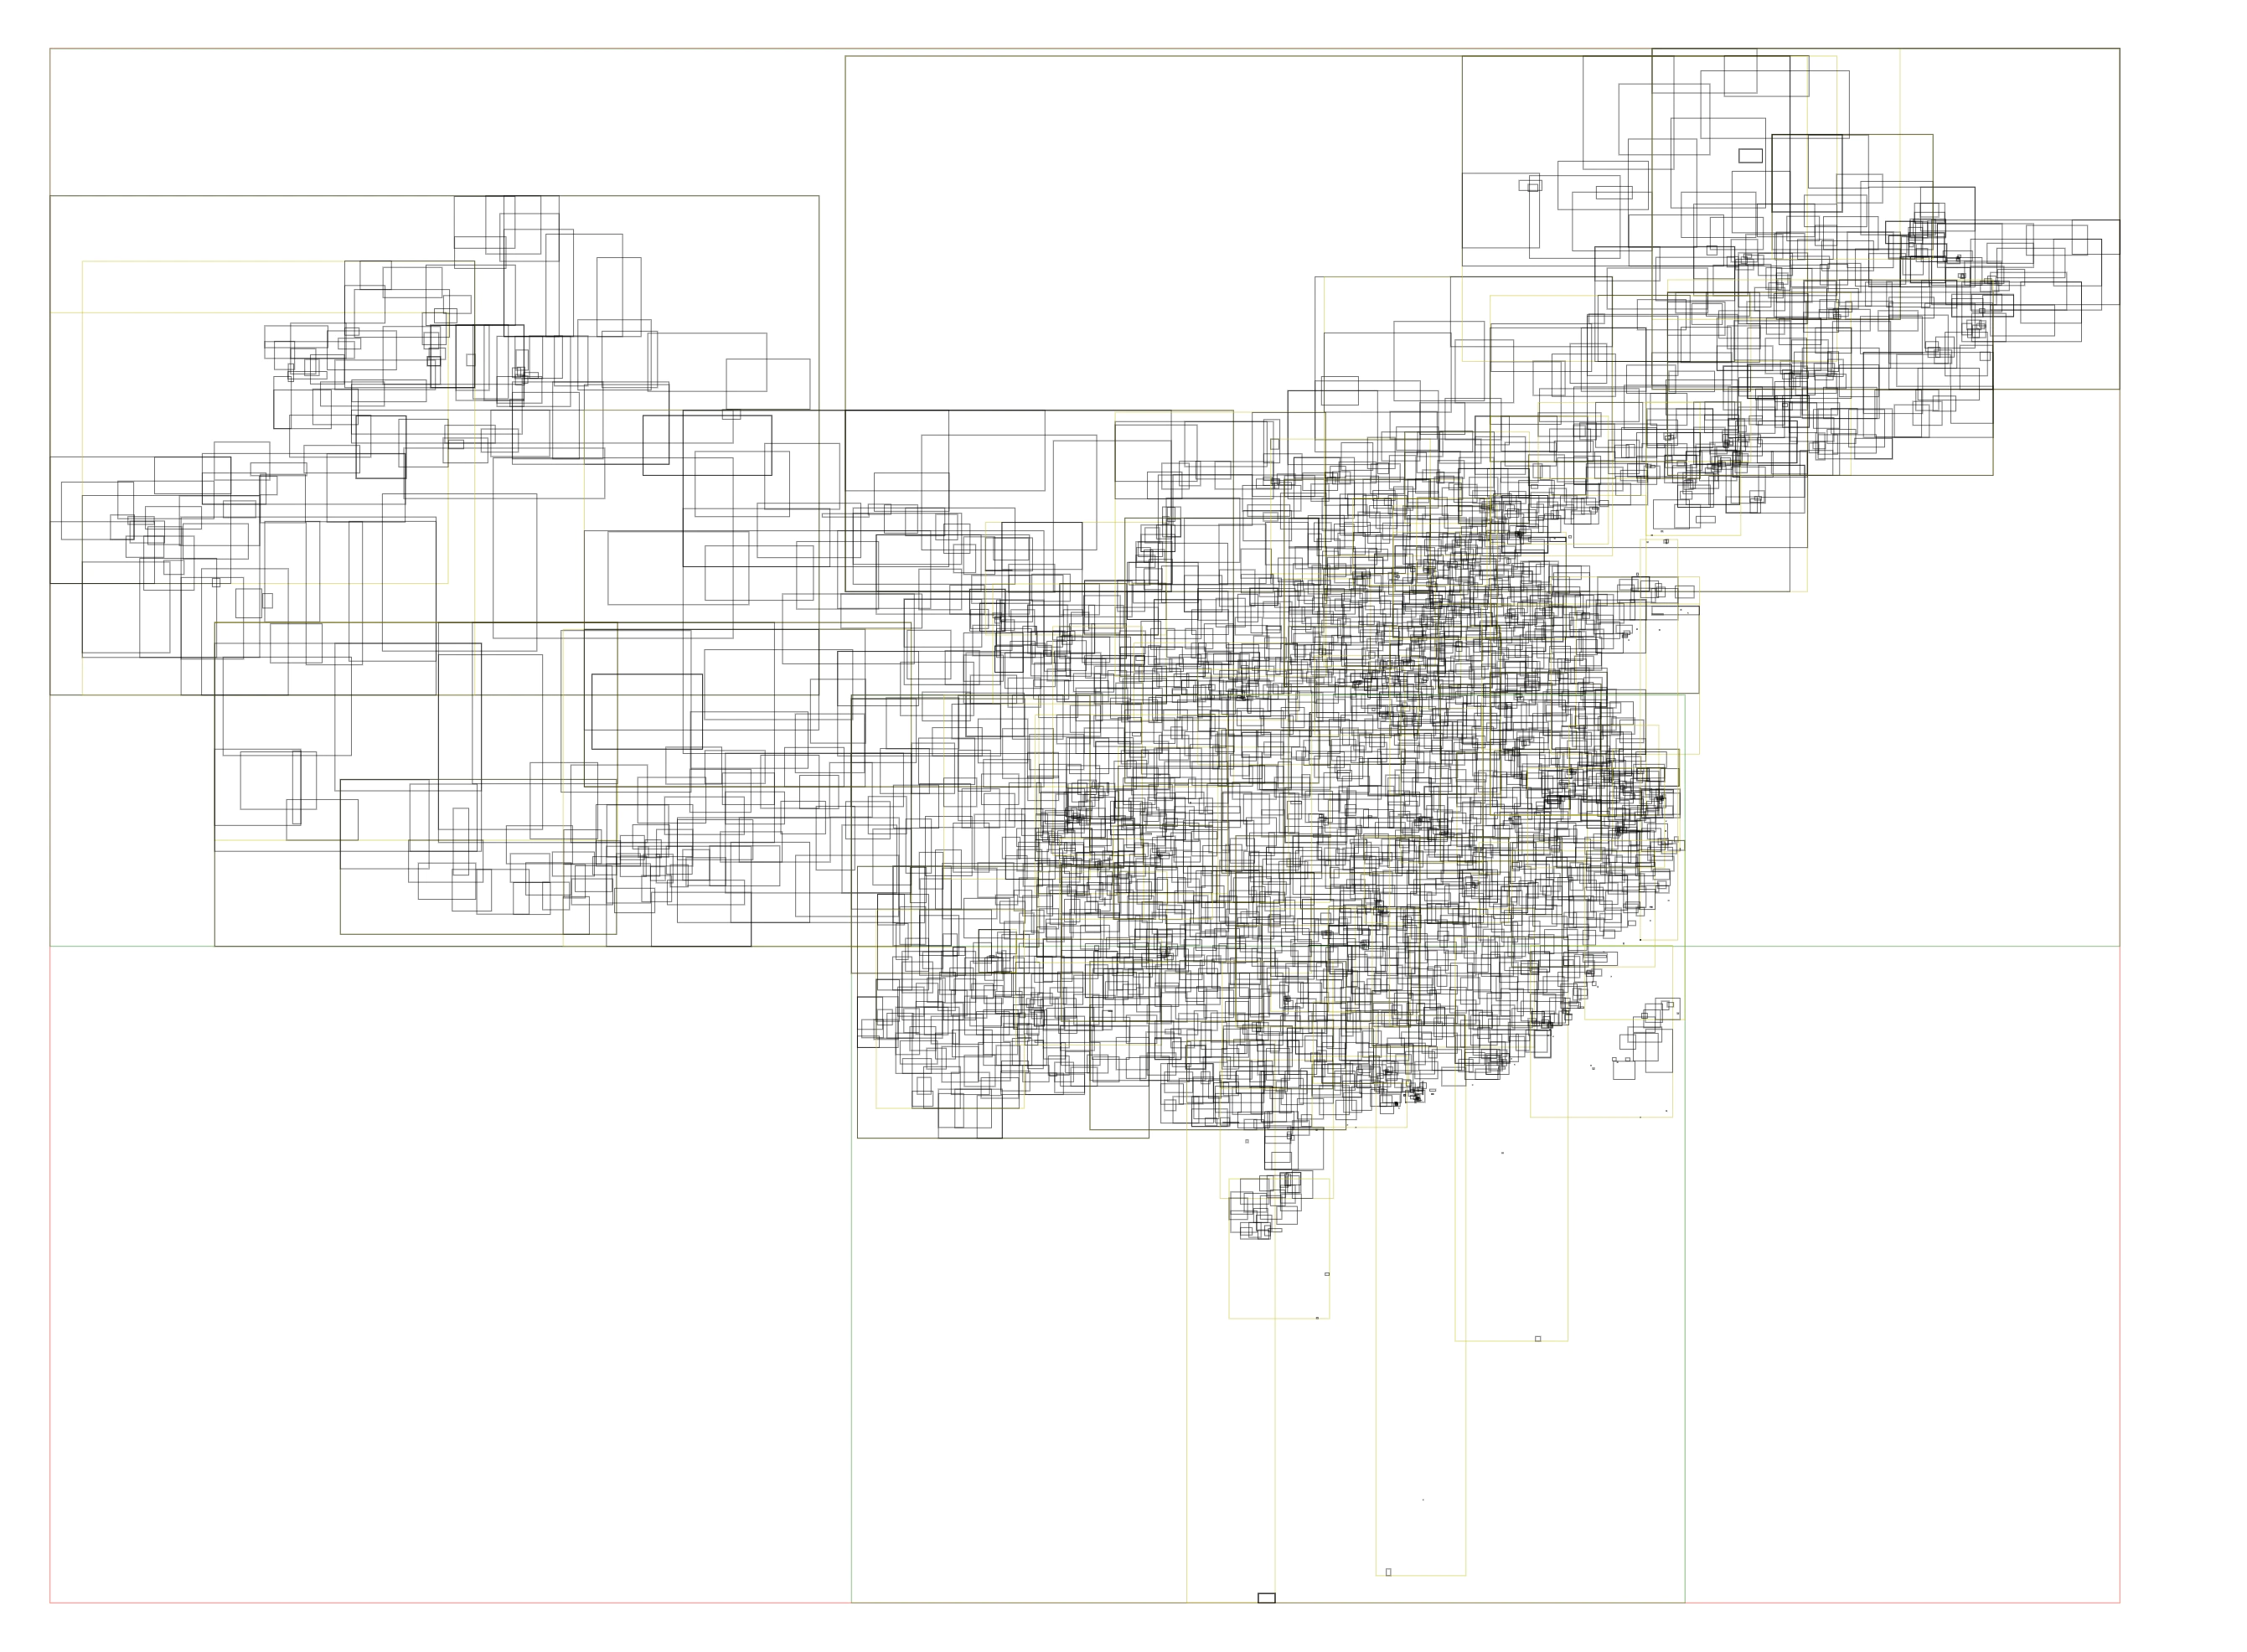
Compared to the original H3 index construction and direct map lookup,
implementing the ray-casting method now takes considerably more time. A single
query takes around 100,000 ns, and in high-concurrency scenarios, it consumed
too much CPU resource. We introduced another layer of RTree indexing on the
outer layer of all polygons to avoid completely traversing thousands of polygons
across the country. As shown in the figure, China’s administrative division
RTree index information:
With the addition of RTree indexing, only dozens of polygon data need to be
checked for identification, reducing overall time consumption by 80%. It takes
around 20,000 ns to obtain administrative division information.