tzf Spring 2026 Update

It has been a few years since the tzf project family was started. The last systematic look back at its development history was History of package tzf in early 2023. Since then, there have been various updates and maintenance work, mostly focused on non-core optimizations and supplementary features. In spring 2026, several long-pending important changes were finally completed: Introducing topology-aware processing to eliminate gaps and overlaps introduced during polygon simplification; Based on topology-aware processing, developing a more efficient data distribution format — ~17 MB for full-precision data and ~5.4 MB for simplified data; Introducing YStripes index acceleration, inspired by the tg project. Topology-Aware Processing The raw data is essentially a collection of polygons. Because the raw boundaries are highly detailed, the data volume is large, so polygon simplification is necessary. Many of these polygons share boundaries, but in the previous approach, each polygon was simplified independently using RDP. This caused a known issue that existed since the project’s early days: gaps appearing in areas that should be fully covered, and unwanted polygon overlaps introduced by simplification: ...
 ·  · 8 min · 1665 words · ringsaturn

Building a High-Performance Elevation API

This article is reposted from Building a High-Performance Elevation API At ColorfulClouds Technology(彩云科技, “cai yun” in Pinyin for 彩云), we are committed to providing users with meteorological data at higher temporal and spatial resolutions. Over the years, we have consistently faced a challenge: due to limitations in elevation data resolution, outdoor activity enthusiasts, particularly those involved in hiking and cross-country activities, often experience noticeable discrepancies between ColorfulClouds’ data and their actual experiences. This issue is especially prominent in mountainous and plateau regions with dramatic elevation changes. ...

 · 3 min · 1040 words · ringsaturn

Creating Elevation RGB Tiles Around Mount Fuji

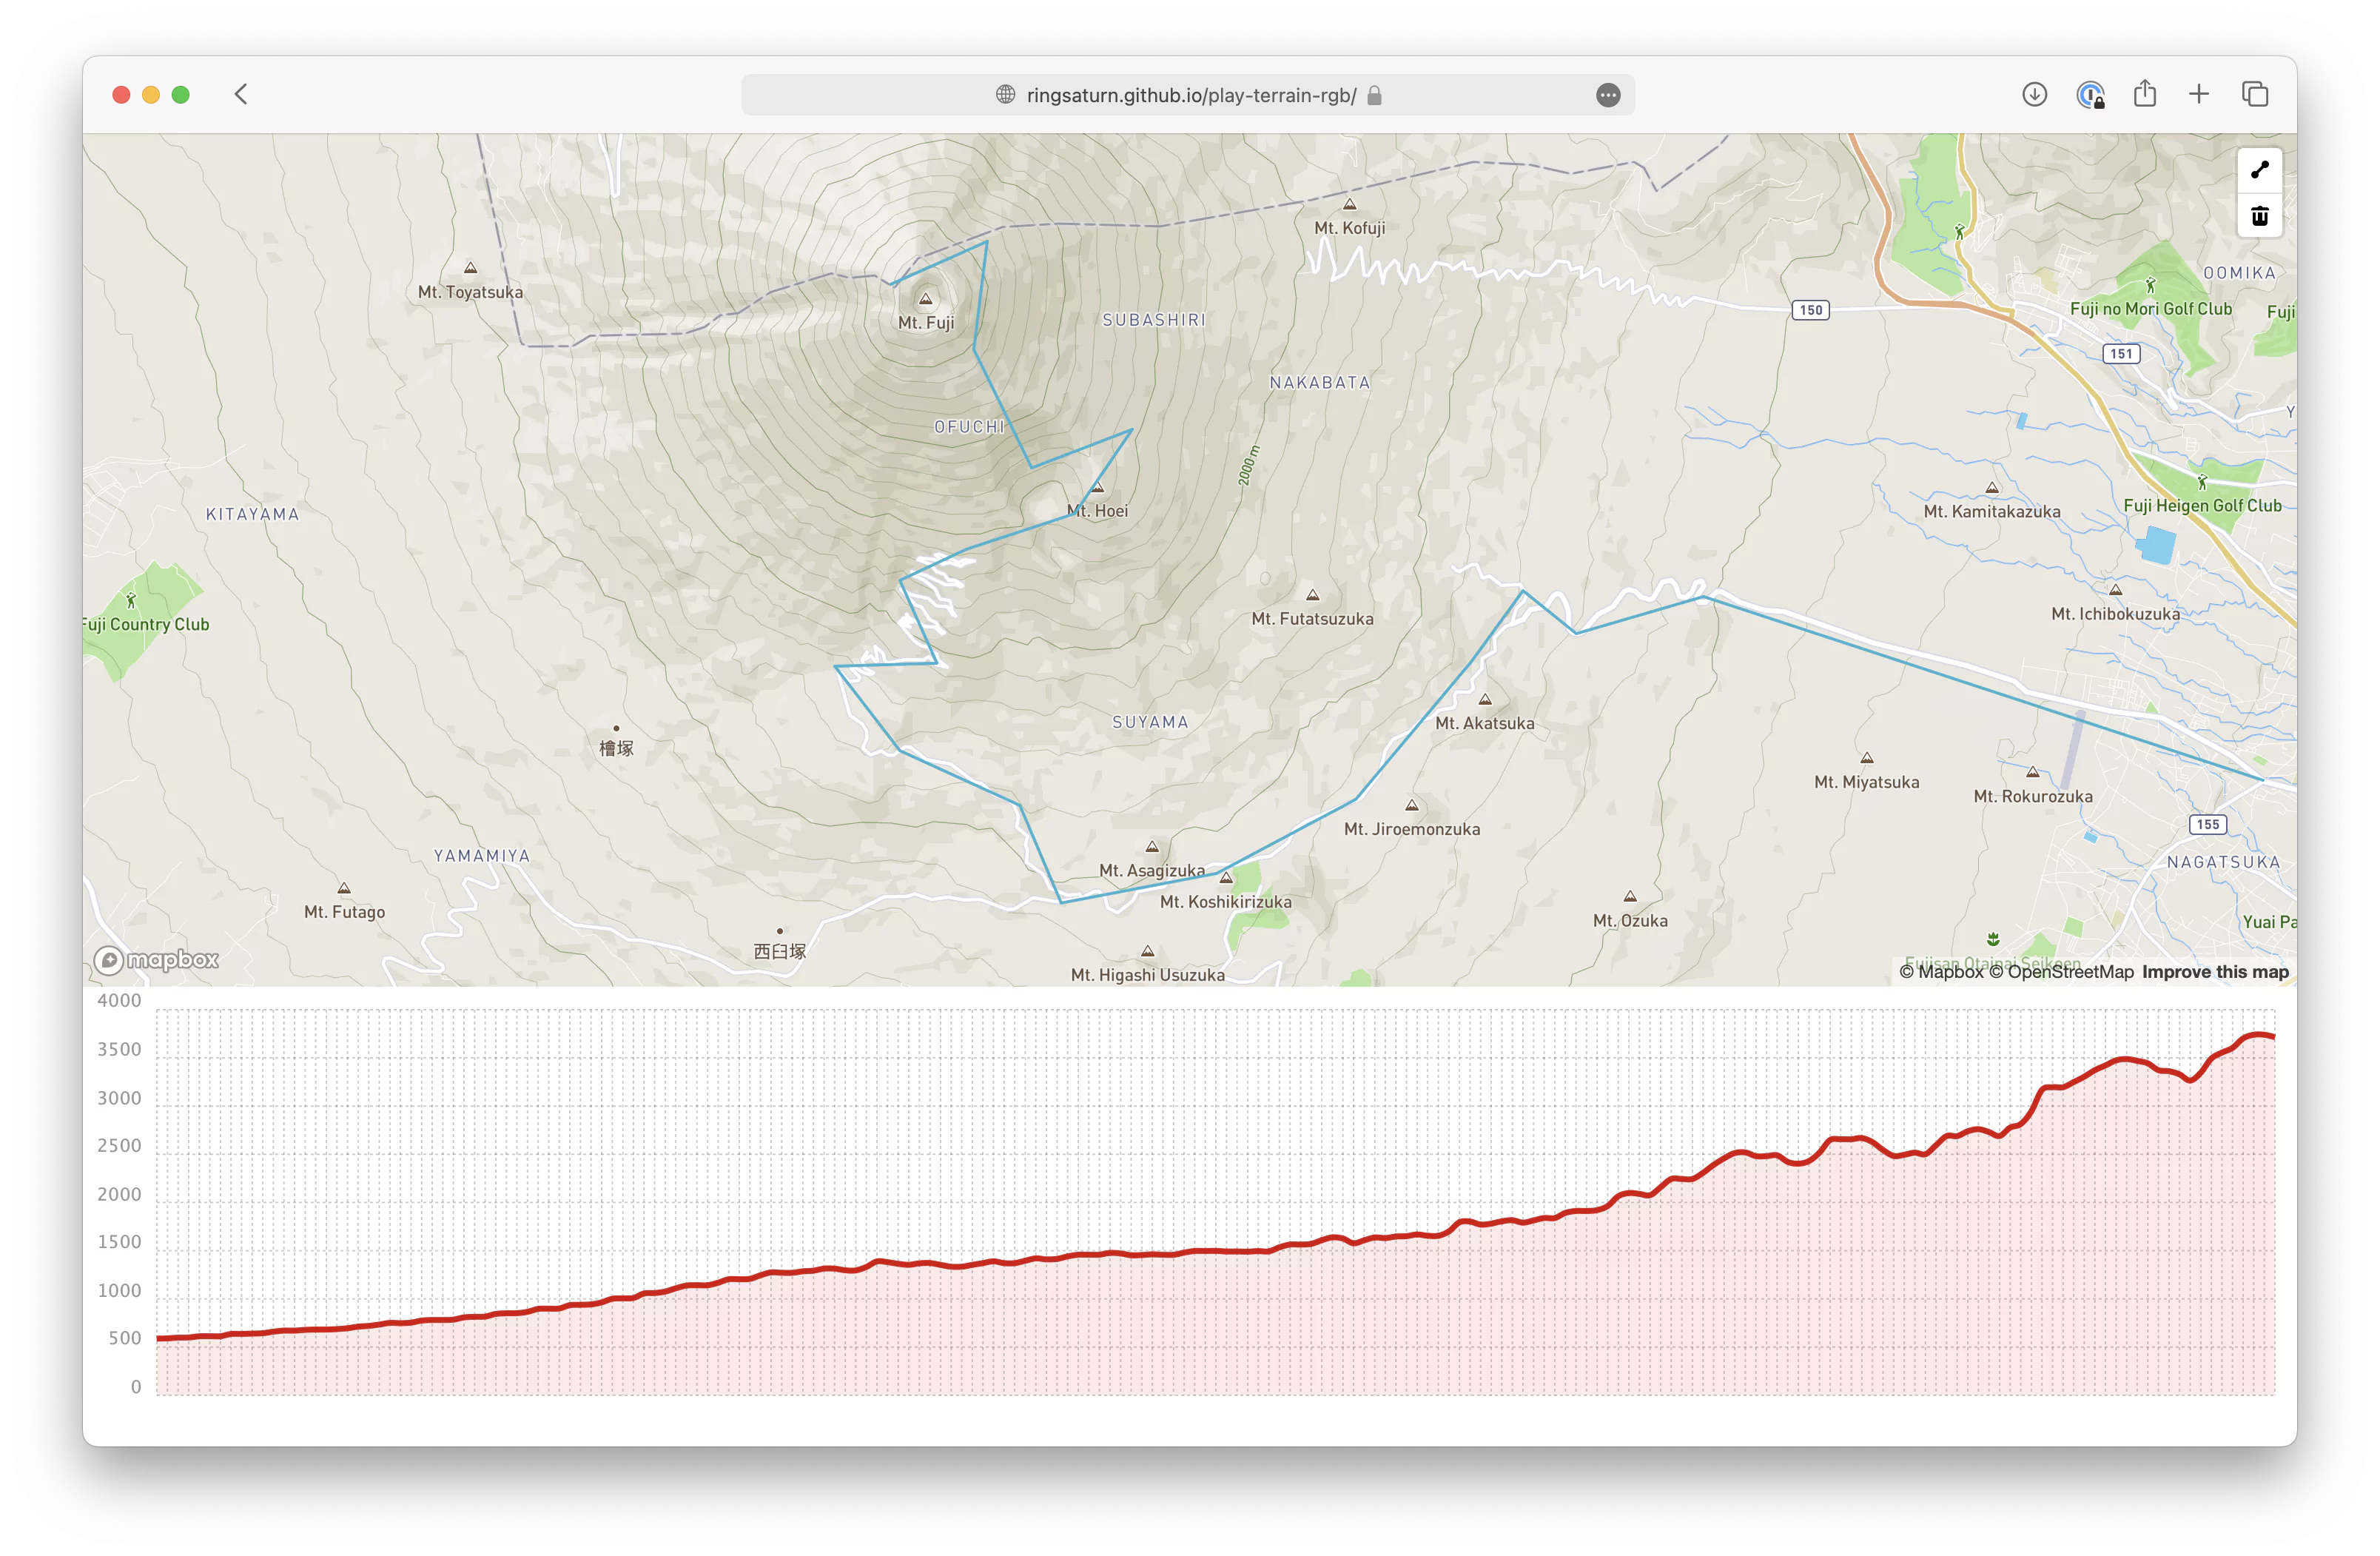
TLDR A few days ago, while searching for information, I discovered MapTiler’s elevation profile visualization page, which works excellently: This is really well done, and it’s entirely implemented in the browser https://t.co/R1vQMbdYAo pic.twitter.com/IyTYy5Fxo1 — ringsaturn.me (@ringsaturn_me) January 10, 2024 On their official blog, I found a 2019 post mentioning that the technique encodes elevation data into the RGB channels of an image and then decodes it in the browser. This allows elevation visualization directly in the browser—especially for continuous profile data—by downloading a few images to plot a continuous elevation curve. ...

 · 5 min · 871 words · ringsaturn

History of package tzf

Introduces the evolution of tzf, from the initial implementation in Go, to the later Python extension, and finally to the current Rust implementation with a PyO3 wrapper.

 · 4 min · 1875 words · ringsaturn

How to look up GPS location belongs to which administration?

This is English version of 《彩云天气地理查询优化(2): 行政区划查询》. With some minor changes. In ColorfulClouds App and ColorfulClouds Weather API, we could get current GPS location’s weather alert information, such as “Gale Blue Alert”. Different countries and regions have different rules for issuing alerts. In China, it is issued according to the administrative division level, and the smallest is the county-level administrative division. Therefore, in the implementation, it is necessary to convert the GPS location into the administrative division level information, and then find the relevant alert information. ...

 · 3 min · 1310 words · ringsaturn

Caiyun Weather Geo Query Optimization (1): Meteorological Station Data Query

This article is reproduced from “Caiyun Weather Geo Query Optimization: The nearest N points” Let’s start from a real-world scenario: How to find the K nearest national observation stations to the 768 Creative Industry Park in Haidian District, Beijing? The simplest approach is to iterate over all candidate stations, compute the distance between each station and the 768 park, and then pick the K smallest distances. The code is straightforward. But the problem is it is slow. ...

 · 4 min · 744 words · ringsaturn

Geographic aggregation using the map tile index

When dealing with large amounts of scattered data, sometimes we need to provide a read-only query API to visualize on a map. When the amount of data is too large, say millions, it is not appropriate to return it all to the front end for processing on the browser. Some aggregation should be completed within the back-end service to return the aggregated search to the front end. Here’s how to do this with the MongoDB + tile index in Go. ...

 · 2 min · 369 words · ringsaturn