Creating Elevation RGB Tiles Around Mount Fuji
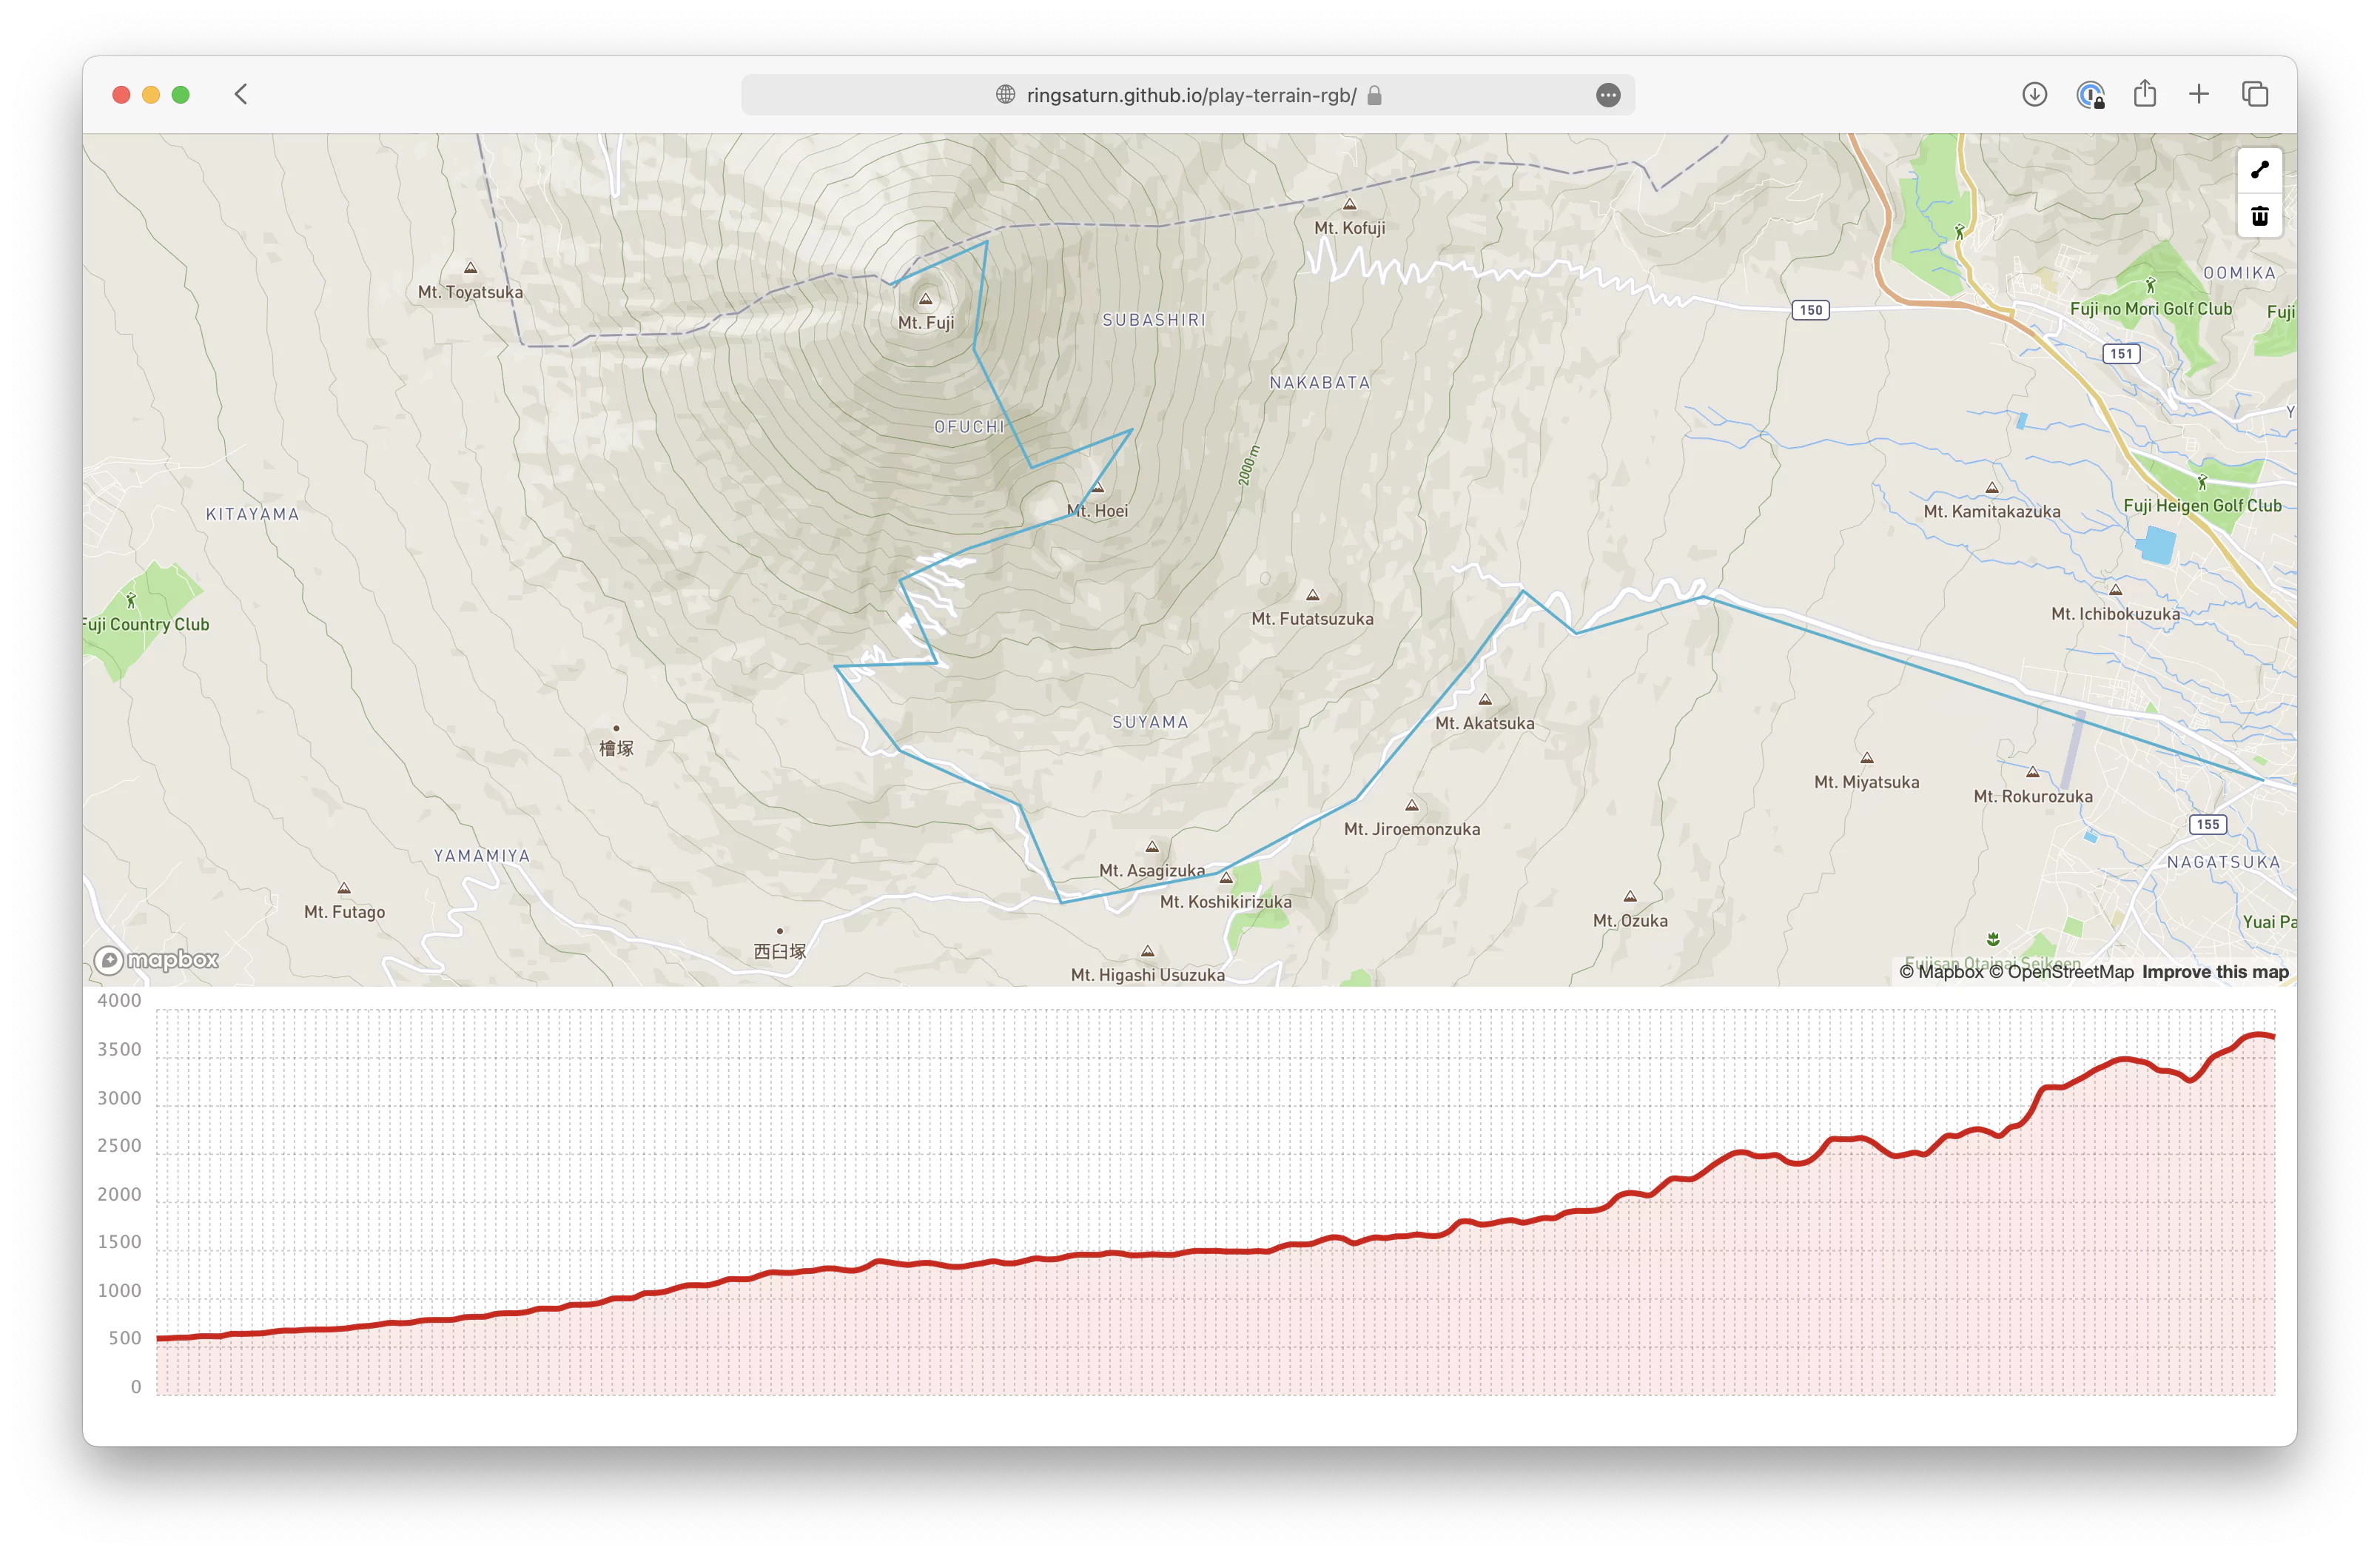
TLDR A few days ago, while searching for information, I discovered MapTiler’s elevation profile visualization page, which works excellently: This is really well done, and it’s entirely implemented in the browser https://t.co/R1vQMbdYAo pic.twitter.com/IyTYy5Fxo1 — ringsaturn.me (@ringsaturn_me) January 10, 2024 On their official blog, I found a 2019 post mentioning that the technique encodes elevation data into the RGB channels of an image and then decodes it in the browser. This allows elevation visualization directly in the browser—especially for continuous profile data—by downloading a few images to plot a continuous elevation curve. ...