Recast GPU WOOF

Today I ran a 12-hour simulation around Mount Fuji at 500 m resolution in the WOOF web app from Recast Systems, with boundary conditions from GFS 0.25°. I think the result is excellent: it ran on an RTX PRO 6000 (on-demand instance), took 11 minutes 40 seconds and cost 1.34 USD in total. Video demo below: https://blog-assets.ringsaturn.me/pic/2026/2026-10-10-recast-gpu-woof/recast-area-tsk-2026-10-10-1600gmt%2B9-mobile.mp4 This surprised me. It suggests that in the future, with higher-resolution real-time observations (satellite remote sensing in particular), rapid rolling corrections to the assimilation output of large-scale models, followed by a model like WOOF, a port of WRF-ARW to the GPU, could bring a large improvement to local weather forecasting and hazard warning, especially for severe convective weather. ...

 · 2 min · 217 words · ringsaturn

My Assessment of the Weather Industry

 · 12 min · 5518 words · ringsaturn

Elevation Correction of 2 m Temperature at Mountain Stations

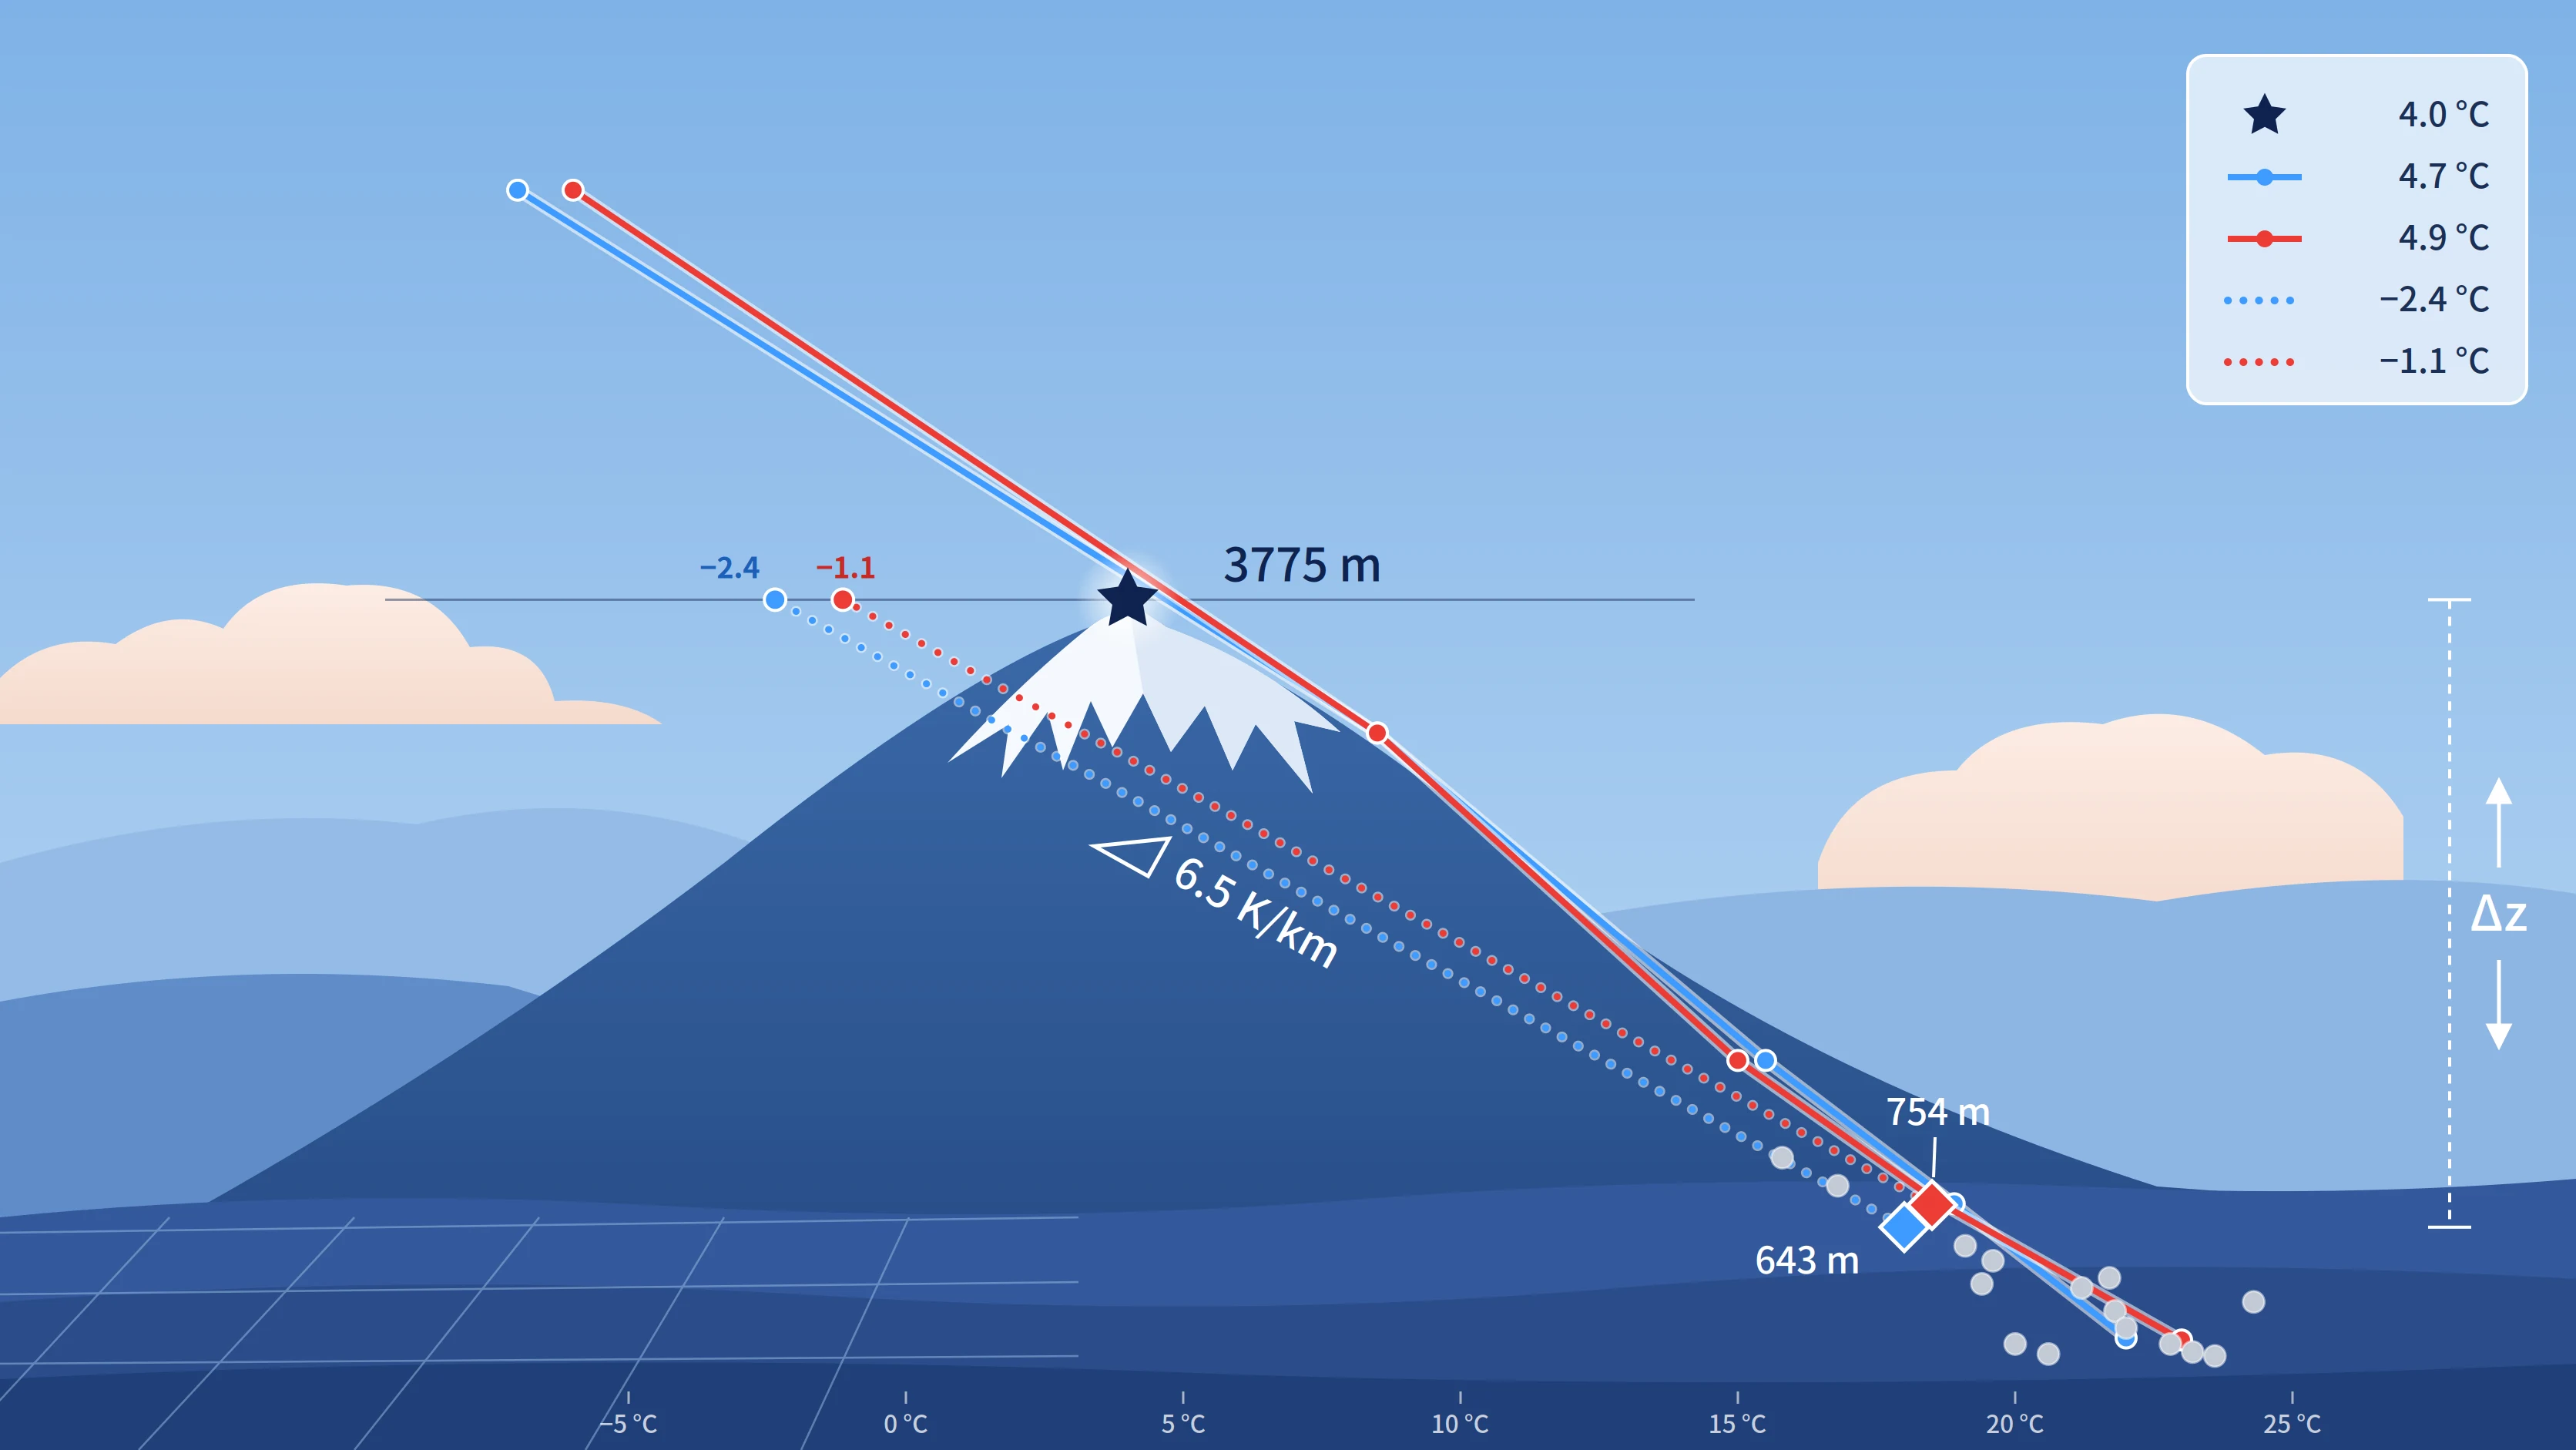
Verifying the 6.5 K/km elevation correction of GFS and ECMWF 2 m temperature against about 3000 stations over four seasons, and the pressure-level method with a decaying near-surface anomaly that xue now uses

 · 17 min · 3544 words · ringsaturn

Xue: A Cloud-Native Stack for Real-Time Weather Data

In the previous post, 雪:更快速更流畅的气象数据动画 (Chinese), I packed forecast variables into a single-file container, .xue, which the browser read frame by frame through its index. For two variables of one GFS run, per-frame precolored PMTiles (zoom 0–4) came to 3,205.87 MB, the source GRIB2 was 137.73 MB, and .xue brought it down to about 65 MB. The size problem was solved. The problem with a custom container is that only its own decoder can read it. ...

 · 4 min · 1993 words · ringsaturn

Multi-Source Weather Analysis with LLMs

Picking up where I left off: earlier this year I built a project called sitian, which analyzes weather processes from a sequence of synoptic charts over a period of time. Using it myself and backtesting it against historical weather, I found that combined analysis across multiple data sources did not work well. Take one example: a region is about to be affected by a typhoon, and the relevant data includes: Radiosonde soundings around the typhoon’s track Model forecast data Satellite observations Radar data Surface observations as supporting context The previous setup made it awkward to handle fairly complex combinations of input data. It also meant maintaining and integrating several data sources. So the sitian project has, in practice, stopped running. ...

 · 2 min · 286 words · ringsaturn

Notes on Open Meteo's UV Index

There is no built-in UV index in the original’s NOAA’s GFS data. However, Open Meteo provides UV index forecast in GFS’s data API and other weather models. That’s very interesting because it means that Open Meteo is doing some additional processing on top of the raw GFS data to derive the UV index. So I dig into it’s source code to see how they are calculating the UV index: 1 2 3 4 5 6 7 8 9 10 11 // https://github.com/open-meteo/open-meteo/blob/bf9577492dde460f9428d5d892b43bab9faa93ef/Sources/App/Gfs/GfsVariableDownloadable.swift#L473-L477 func multiplyAdd(domain: GfsDomain) -> (multiply: Float, add: Float)? { switch self { // ... case .uv_index, .uv_index_clear_sky: // UVB to etyhemally UV factor 18.9 https://link.springer.com/article/10.1039/b312985c // 0.025 m2/W to get the uv index // compared to https://www.aemet.es/es/eltiempo/prediccion/radiacionuv return (18.9 * 0.025, 0) // ... That make things simple. Just use existing GFS UVB data and apply a simple linear transformation to get the UV index.

 · 1 min · 147 words · ringsaturn
China’s first WSR-88D Doppler weather radar (Image source: [The Paper](https://www.thepaper.cn/newsDetail_forward_26004388))

Historical Fragments of China's Meteorological Radars

Some historical fragments discovered while researching.

 ·  · 11 min · 5139 words · ringsaturn