TLDR# 前几日查资料的时候发现了 MapTiler
制作的轨迹高程数据可视化页面 ,效果非常好:
在其官方的 Blog 找到了
2019 年的博文
提到了使用的技术是将高程数据编码到图片的 RGB
通道值中,然后在浏览器中解码,这样就可以在浏览器中实现高程数据的可视化了,特别是轨迹数据这种连续的数据,下载几张图片就能绘制连续的高程曲线。
在 GitHub 上找到了
syncpoint/terrain-rgb
项目,提供了一个完整的高程数据转换成 RGB 图片的说明。
整理好的代码信息放到了仓库
ringsaturn/play-terrain-rgb@syncpoint
的完全一致,只是若干细节参数和原始数据有出入。
另外也修改了
https://github.com/maptiler/samples/tree/main/cloud/elevation-profile
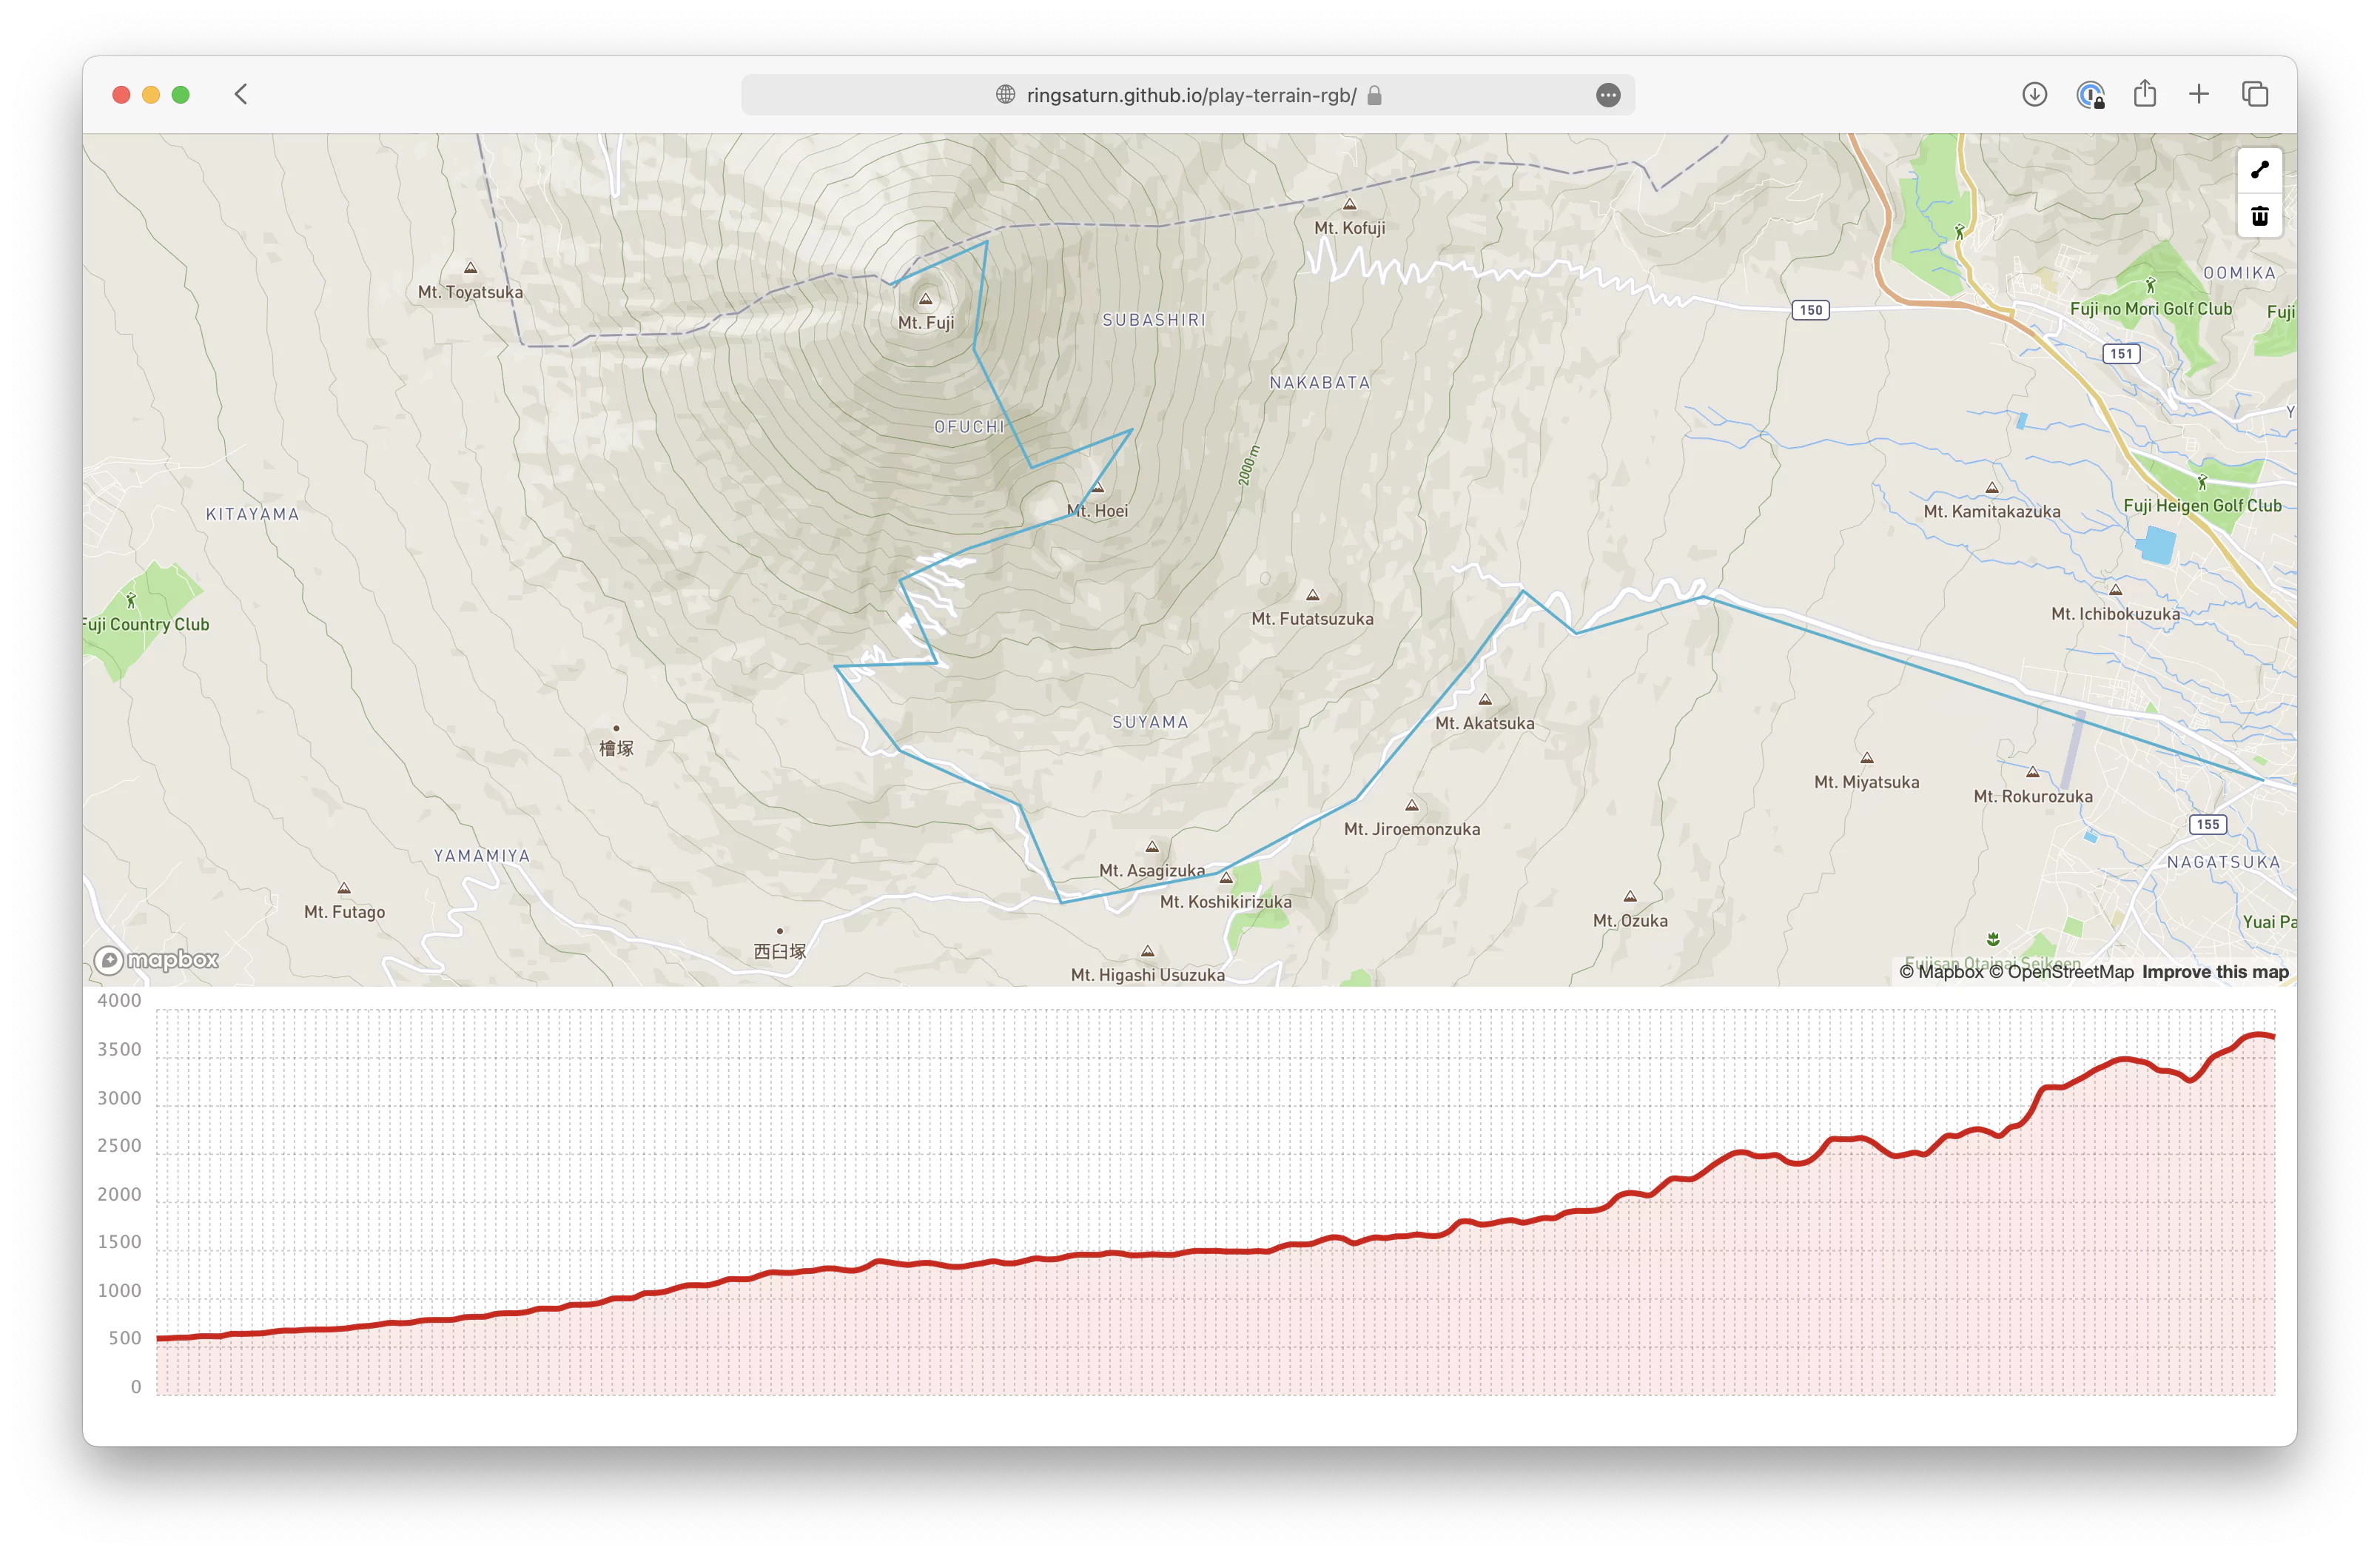
的代码发布一个富士山周围的高程数据的可视化页面,效果如下:
体验地址是 https://ringsaturn.github.io/play-terrain-rgb
制作流程# 下载了 ASTER GDEM v3 的数据,这是一个全球的 30m 分辨率的高程数据,下载地址在
USGS 的网站 。
因为只是一个 demo 所以我只用了覆盖富士山的文件 ASTGTMV003_N35E138_dem.tif。
按照上述仓库的说明,我需要准备一个含有多种地理数据计算的软件环境:
1
brew install gdal geoip libspatialite librasterlite spatialite-gui spatialite-tools
后续的数据处理用了大量 Python 的地理生态软件,简单的起见我用了 Conda
初始化了一个 Python 3.11 的虚拟环境
1
conda create -n play-terrain-rgb python = 3.11
然后安装依赖,和原始仓库的说法稍有不同的是 rasterio 需要自行编译的方式安装:
1
pip install rasterio --no-binary rasterio
否则 rio 会找到不到 rgbify 这个命令行插件。
然后就能安装其他依赖了:
1
pip rasterio rio-rgbify rio-mbtiles mbutil
用 rio info 可以查看一下原始的 DEM 数据的信息:
1
rio info --indent 2 ASTGTMV003_N35E138_dem.tif
 1
 2
 3
 4
 5
 6
 7
 8
 9
10
11
12
13
14
15
16
17
18
19
20
21
22
23
24
25
26
27
28
29
30
31
32
33
34
35
36
37
38
39
40
41
42
43
44
45
46
47
48
49
50
51
52
53
54
55
56
57
58
59
60
{
"blockxsize" : 256 ,
"blockysize" : 256 ,
"bounds" : [
137.999861111111 ,
34.99986111111112 ,
139.00013888888876 ,
36.0001388888889
],
"colorinterp" : [
"gray"
],
"compress" : "lzw" ,
"count" : 1 ,
"crs" : "EPSG:4326" ,
"descriptions" : [
"Band 1"
],
"driver" : "GTiff" ,
"dtype" : "int16" ,
"height" : 3601 ,
"indexes" : [
1
],
"interleave" : "band" ,
"lnglat" : [
138.4999999999999 ,
35.500000000000014
],
"mask_flags" : [
[
"all_valid"
]
],
"nodata" : null ,
"res" : [
0.000277777777777778 ,
0.000277777777777778
],
"shape" : [
3601 ,
3601
],
"tiled" : true ,
"transform" : [
0.000277777777777778 ,
0.0 ,
137.999861111111 ,
0.0 ,
-0.000277777777777778 ,
36.0001388888889 ,
0.0 ,
0.0 ,
1.0
],
"units" : [
null
],
"width" : 3601
}
因为原始数据覆盖的空间范围太大了,我们只需要富士山周围的数据,所以需要先裁切一次:
1
gdal_translate -projwin 138.626942 35.439672 138.899882 35.255449 ASTGTMV003_N35E138_dem.tif ASTGTMV003_N35E138_dem_clip.tif
然后需要将文件转换成 Web Mercator 投影的坐标系,这样才能在浏览器中显示:
1
gdalwarp -t_srs EPSG:3857 -dstnodata None -novshiftgrid -co TILED = YES -co COMPRESS = DEFLATE -co BIGTIFF = IF_NEEDED -r lanczos ASTGTMV003_N35E138_dem_clip.tif ASTGTMV003_N35E138_dem_clip_EPSG3857.tif
1
2
Creating output file that is 914P x 756L.
Processing ASTGTMV003_N35E138_dem_clip.tif [1/1] : 0...10...20...30...40...50...60...70...80...90...100 - done.
查看一下转换后的文件信息:
1
rio info --indent 2 ASTGTMV003_N35E138_dem_clip_EPSG3857.tif
 1
 2
 3
 4
 5
 6
 7
 8
 9
10
11
12
13
14
15
16
17
18
19
20
21
22
23
24
25
26
27
28
29
30
31
32
33
34
35
36
37
38
39
40
41
42
43
44
45
46
47
48
49
50
51
52
53
54
55
56
57
58
59
60
{
"blockxsize" : 256 ,
"blockysize" : 256 ,
"bounds" : [
15431865.404742576 ,
4198669.725048377 ,
15462269.950626153 ,
4223818.342868929
],
"colorinterp" : [
"gray"
],
"compress" : "deflate" ,
"count" : 1 ,
"crs" : "EPSG:3857" ,
"descriptions" : [
"Band 1"
],
"driver" : "GTiff" ,
"dtype" : "int16" ,
"height" : 756 ,
"indexes" : [
1
],
"interleave" : "band" ,
"lnglat" : [
138.76336989692504 ,
35.347779733715655
],
"mask_flags" : [
[
"all_valid"
]
],
"nodata" : null ,
"res" : [
33.265367487502644 ,
33.265367487502644
],
"shape" : [
756 ,
914
],
"tiled" : true ,
"transform" : [
33.265367487502644 ,
0.0 ,
15431865.404742576 ,
0.0 ,
-33.265367487502644 ,
4223818.342868929 ,
0.0 ,
0.0 ,
1.0
],
"units" : [
null
],
"width" : 914
}
然后就可以用 rio rgbify 命令将高程数据转换成 RGB 图片了:
1
rio rgbify -b -10000 -i 0.001 ASTGTMV003_N35E138_dem_clip_EPSG3857.tif ASTGTMV003_N35E138_dem_clip_EPSG3857.RGB.tif
出来的图片大致效果如下:
我们可以简单查询一下原始文件中目标经纬度的高程数据:
1
gdallocationinfo -wgs84 ASTGTMV003_N35E138_dem.tif 138.72739076614383 35.36067113569001
1
2
3
4
Report:
  Location: (2619P,2302L)
  Band 1:
    Value: 3756
然后查询一下转换后的 RGB 文件中的数据:
1
gdallocationinfo -wgs84 ASTGTMV003_N35E138_dem_clip_EPSG3857.RGB.tif 138.72739076614383 35.36067113569001
1
2
3
4
5
6
7
8
Report:
  Location: (336P,325L)
  Band 1:
    Value: 209
  Band 2:
    Value: 234
  Band 3:
    Value: 72
读出来的三个值分别是 2, 222, 56,然后根据转换公式: $height = -10000 + ((R \times
256 \times 256 + G \times 256 + B) \times 0.001)$(备注 0.0001 系数是
rio rgbify 时的 -i 参数值),我们可以计算出高程值:
1
2
height = - 10000 + (( 209 * 256 * 256 + 234 * 256 + 72 ) * 0.001 )
# 3757
误差是可以接受的。
接着为了在地图上展示,我们需要将 RGB 图片转换成瓦片,这里我用了 gdal2tiles.py
这个工具:
1
time gdal2tiles.py --zoom= 5-19 --processes= 16 ASTGTMV003_N35E138_dem_clip_EPSG3857.RGB.tif ./tiles
1
2
3
4
5
Generating Base Tiles:
...10...20...30...40...50...60...70...80...90...100 - done.
Generating Overview Tiles:
0...10...20...30...40...50...60...70...80...90...100 - done.
gdal2tiles.py --zoom=5-19 --processes=16  ./tiles  1332.07s user 360.34s system 1297% cpu 2:10.39 total
PS: 如果在过程中多次生成瓦片后 gdal2tiles.py 会修改生成的 HTML 文件里的 zoom
range,所以还需要看实际情况手动修改。
最后我们可以用 mb-util 将瓦片转换成 MBTiles 格式:
1
mb-util --image_format= png --scheme= tms ./tiles/ ./ASTGTMV003_N35E138_dem_clip_EPSG3857.RGB.mbtiles
1
176000 tiles inserted (24076 tiles/sec)mb-util --image_format=png --scheme=tms ./tiles/ 2.12s user 3.92s system 75% cpu 7.995 total